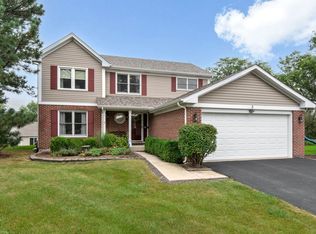
$393,100
3 bd3 ba1.9k sqft
462 Bradford Pl, Bolingbrook, IL 60490
Off Market
Listing description withheld by the listing agent.
Zillow last checked:
Listing updated:
Litsa Lekatsos, C-RET,CSC (630)202-1776,
Compass

Not available
Estimated sales range
Not available
Not available
| Date | Event | Price |
|---|---|---|
| 11/2/2026 | Listed for sale | $439,900+65.1%$183/sqft |
Source:  MRED as distributed by MLS GRID #12785921 Report a problem | ||
| 4/2/2020 | Sold | $266,500-4.8%$111/sqft |
Source: MRED as distributed by MLS GRID #10561232 Report a problem | ||
| 2/23/2020 | Pending sale | $279,900$116/sqft |
Source: Home Realty & Assoc #10561232 Report a problem | ||
| 2/10/2020 | Price change | $279,900-1.8%$116/sqft |
Source: Home Realty & Assoc #10561232 Report a problem | ||
| 1/27/2020 | Price change | $284,900-0.3%$118/sqft |
Source: Home Realty & Assoc #10561232 Report a problem | ||
| 1/18/2020 | Price change | $285,900-0.3%$119/sqft |
Source: Home Realty & Assoc #10561232 Report a problem | ||
| 1/2/2020 | Price change | $286,900-0.3%$119/sqft |
Source: Home Realty & Assoc #10561232 Report a problem | ||
| 12/16/2019 | Price change | $287,900-0.3%$120/sqft |
Source: Home Realty & Assoc #10561232 Report a problem | ||
| 12/4/2019 | Price change | $288,900-0.3%$120/sqft |
Source: Home Realty & Assoc #10561232 Report a problem | ||
| 11/7/2019 | Price change | $289,900-1.7%$121/sqft |
Source: Home Realty & Assoc #10561232 Report a problem | ||
| 10/30/2019 | Listed for sale | $294,900+35.3%$123/sqft |
Source: Home Realty & Assoc #10561232 Report a problem | ||
| 11/15/1999 | Sold | $218,000$91/sqft |
Source: Public Record Report a problem | ||
| Year | Property taxes | Tax assessment |
|---|---|---|
| 2024 | $10,689 +6.6% | $123,735 +11.1% |
| 2023 | $10,024 +7.5% | $111,332 +10.9% |
| 2022 | $9,328 +5.5% | $100,372 +7% |
| 2021 | $8,844 +11.6% | $93,849 +5% |
| 2020 | $7,926 +3.7% | $89,363 +5% |
| 2019 | $7,646 +4.5% | $85,107 +4.5% |
| 2018 | $7,318 +5.5% | $81,458 +5.5% |
| 2017 | $6,940 +3.4% | $77,212 +5.1% |
| 2016 | $6,712 +4.1% | $73,500 +6.4% |
| 2015 | $6,448 | $69,100 |
| 2014 | $6,448 +3.6% | $69,100 +0.4% |
| 2013 | $6,225 -3.2% | $68,800 -8.3% |
| 2012 | $6,431 +1.7% | $75,000 -10% |
| 2011 | $6,321 -1.3% | $83,300 -9.9% |
| 2010 | $6,404 +2% | $92,500 -2.9% |
| 2009 | $6,277 -0.7% | $95,300 -5.9% |
| 2008 | $6,318 | $101,300 +4.1% |
| 2007 | -- | $97,300 +15% |
| 2006 | $5,606 +5.3% | $84,600 +10% |
| 2005 | $5,324 -0.6% | $76,900 |
| 2004 | $5,356 +8.8% | $76,900 +10% |
| 2003 | $4,922 +3.8% | $69,900 +9.7% |
| 2002 | $4,741 -4.7% | $63,700 |
| 2001 | $4,972 +5.1% | $63,700 |
| 2000 | $4,732 | $63,700 |
Source: MRED as distributed by MLS GRID. This data may not be complete. We recommend contacting the local school district to confirm school assignments for this home.
A local agent can set up tours, give advice and negotiate with sellers.