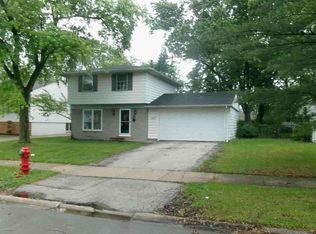
$185,000
3 bd1 ba972 sqft
513 E Birch Dr, Glenwood, IL 60425
Off Market
Listing description withheld by the listing agent.
Zillow last checked:
Listing updated:
Amber Holup 708-870-6835,
HomeSmart Realty Group
$168,800
$160,000 - $177,000
$2,945/mo
| Date | Event | Price |
|---|---|---|
| 10/23/2026 | Listing removed | $170,000$175/sqft |
Source:  MRED as distributed by MLS GRID #12792232 Report a problem | ||
| 10/23/2026 | Listed for rent | $2,300$2/sqft |
Source: MRED as distributed by MLS GRID #12792905 Report a problem | ||
| 10/22/2026 | Listed for sale | $170,000+269.6%$175/sqft |
Source: MRED as distributed by MLS GRID #12792232 Report a problem | ||
| 3/26/2026 | Listing removed | $2,300$2/sqft |
Source: Zillow Rentals Report a problem | ||
| 3/13/2026 | Listed for rent | $2,300+15%$2/sqft |
Source: Zillow Rentals Report a problem | ||
| 2/14/2024 | Listing removed | -- |
Source: Zillow Rentals Report a problem | ||
| 2/5/2024 | Price change | $2,000-9.1%$2/sqft |
Source: Zillow Rentals Report a problem | ||
| 12/23/2023 | Price change | $2,200-8.3%$2/sqft |
Source: Zillow Rentals Report a problem | ||
| 12/4/2023 | Listed for rent | $2,400+26.3%$2/sqft |
Source: Zillow Rentals Report a problem | ||
| 10/7/2021 | Listing removed | -- |
Source: Zillow Rental Manager Report a problem | ||
| 9/28/2021 | Listed for rent | $1,900+58.3%$2/sqft |
Source: Zillow Rental Manager Report a problem | ||
| 7/30/2021 | Sold | $46,000-64.9%$47/sqft |
Source: Public Record Report a problem | ||
| 12/19/2018 | Listing removed | $1,200$1/sqft |
Source: Zillow Rental Network Report a problem | ||
| 10/10/2018 | Listed for rent | $1,200+4.3%$1/sqft |
Source: Zillow Rental Network Report a problem | ||
| 1/31/2017 | Sold | $131,000+211.9%$135/sqft |
Source: Public Record Report a problem | ||
| 7/8/2012 | Listing removed | $1,150$1/sqft |
Source: Where Comfort Meets Value Report a problem | ||
| 5/23/2012 | Listed for rent | $1,150$1/sqft |
Source: Where Comfort Meets Value Report a problem | ||
| 7/21/2010 | Sold | $42,003-55.3%$43/sqft |
Source: MRED as distributed by MLS GRID #07387545 Report a problem | ||
| 10/1/2004 | Sold | $94,000$97/sqft |
Source: Public Record Report a problem | ||
| Year | Property taxes | Tax assessment |
|---|---|---|
| 2024 | $5,647 +6.7% | $13,000 |
| 2023 | $5,294 -7.8% | $13,000 +21.3% |
| 2022 | $5,745 +0.6% | $10,716 |
| 2021 | $5,710 +0% | $10,716 |
| 2020 | $5,708 +36.5% | $10,716 +39.4% |
| 2019 | $4,181 +5.2% | $7,689 |
| 2018 | $3,975 -0.8% | $7,689 |
| 2017 | $4,009 +5.2% | $7,689 +6.8% |
| 2016 | $3,810 +3.1% | $7,202 |
| 2015 | $3,696 +1.8% | $7,202 |
| 2014 | $3,632 +9.1% | $7,202 -1.3% |
| 2013 | $3,328 +2.8% | $7,300 |
| 2012 | $3,238 +8.8% | $7,300 |
| 2011 | $2,977 +30.5% | $7,300 +15.2% |
| 2010 | $2,282 -41.9% | $6,338 -42.8% |
| 2009 | $3,931 +53.7% | $11,080 -5% |
| 2008 | $2,557 +12.6% | $11,663 +24.1% |
| 2007 | $2,272 -17.7% | $9,400 |
| 2006 | $2,759 +35.7% | $9,400 |
| 2005 | $2,034 -19% | $9,400 +7.4% |
| 2004 | $2,512 +27.7% | $8,754 |
| 2003 | $1,967 -4.1% | $8,754 |
| 2002 | $2,052 -7% | $8,754 +13.3% |
| 2001 | $2,207 +38.3% | $7,729 |
| 2000 | $1,596 +10.7% | $7,729 |
| 1999 | $1,442 | $7,729 |
Source: MRED as distributed by MLS GRID. This data may not be complete. We recommend contacting the local school district to confirm school assignments for this home.


A local agent can set up tours, give advice and negotiate with sellers.
A local lender can help you make sure your offer is ready when you are.