This 1419 square foot single family home has 3 bedrooms and 2.0 bathrooms. This home is located at 10012 Glenbrook St, Riverside, CA 92503.
Pre-foreclosure
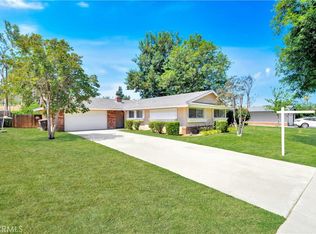
Street View
Est. $623,700
10012 Glenbrook St, Riverside, CA 92503
3beds
2baths
1,419sqft
SingleFamily
Built in 1964
10,018 Square Feet Lot
$623,700 Zestimate®
$440/sqft
$-- HOA
Overview
- 152 days |
- 12 |
- 0 |
Facts & features
Interior
Bedrooms & bathrooms
- Bedrooms: 3
- Bathrooms: 2
Heating
- Other
Cooling
- Central
Features
- Has fireplace: Yes
Interior area
- Total interior livable area: 1,419 sqft
Property
Parking
- Parking features: Garage - Attached
Features
- Exterior features: Cement / Concrete
Lot
- Size: 10,018 Square Feet
Details
- Parcel number: 234214013
Construction
Type & style
- Home type: SingleFamily
Materials
- wood frame
- Roof: Composition
Condition
- Year built: 1964
Community & HOA
Location
- Region: Riverside
Financial & listing details
- Price per square foot: $440/sqft
- Tax assessed value: $222,830
- Annual tax amount: $2,461
Visit our professional directory to find a foreclosure specialist in your area that can help with your home search.
Find a foreclosure agentForeclosure details
Estimated market value
$623,700
$586,000 - $661,000
$3,062/mo
Price history
| Date | Event | Price |
|---|---|---|
| 3/17/2000 | Sold | $145,000+16%$102/sqft |
Source: Public Record Report a problem | ||
| 8/28/1998 | Sold | $125,000$88/sqft |
Source: Public Record Report a problem | ||
Public tax history
| Year | Property taxes | Tax assessment |
|---|---|---|
| 2025 | $2,461 +3.4% | $222,830 +2% |
| 2024 | $2,380 +0.5% | $218,462 +2% |
| 2023 | $2,369 +1.9% | $214,179 +2% |
| 2022 | $2,324 +0.9% | $209,980 +2% |
| 2021 | $2,303 +0.8% | $205,864 +1% |
| 2020 | $2,285 +2% | $203,754 +2% |
| 2019 | $2,241 +2% | $199,760 +2% |
| 2018 | $2,196 +1.8% | $195,844 +2% |
| 2017 | $2,157 | $192,005 +2% |
| 2016 | $2,157 +8.4% | $188,241 +1.5% |
| 2015 | $1,989 +1% | $185,416 +2% |
| 2014 | $1,969 | $181,786 +0.5% |
| 2013 | -- | $180,965 +2% |
| 2012 | -- | $177,418 +5% |
| 2011 | -- | $169,000 -2.1% |
| 2010 | -- | $172,642 -0.2% |
| 2009 | -- | $173,054 +2% |
| 2008 | -- | $169,661 +2% |
| 2007 | -- | $166,335 +2% |
| 2006 | -- | $163,075 +2% |
| 2005 | -- | $159,879 +3.9% |
| 2003 | -- | $153,874 +2% |
| 2002 | -- | $150,858 +2% |
| 2001 | $1,538 +15.3% | $147,900 +16% |
| 2000 | $1,333 | $127,500 |
Find assessor info on the county website
Monthly payment
Estimated monthly payment$1,822
All calculations are estimates and provided by Zillow, Inc. for informational purposes only. Actual amounts may vary.
HOA fees may include property taxes on listings classified as Co-Ops. Contact the listing agent and/or owner for fee details.
Mortgage interest rates are dependent on a number of factors, including credit score, down payment, and repayment length. Interest rate data provided by Zillow Group Marketplace, Inc. as of 1/1/1970 from various mortgage lenders with which we have lead or other similar arrangements; the Estimated Payment is an average of those rates.
See how much you could borrow to make a competitive offer.
Climate risks
Neighborhood: Arlington South
Nearby schools
GreatSchools rating
- 3/10Harrison Elementary SchoolGrades: K-6Distance: 0.3 mi
- 5/10Chemawa Middle SchoolGrades: 7-8Distance: 1.8 mi
- 4/10Arlington High SchoolGrades: 9-12Distance: 1.4 mi


- California
- Riverside County
- Riverside
- 92503
- Arlington South
- 10012 Glenbrook St
Nearby cities
Nearby neighborhoods
Nearby zip codes
Other Riverside Topics
