This is a 1887 square foot, 7.0 bathroom, single family home. This home is located at 1003 Simpson St, Pensacola, FL 32526.
Pre-foreclosure
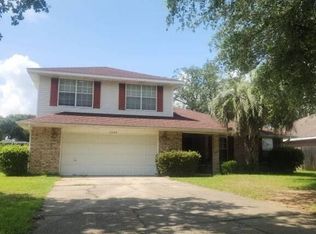
Street View
Est. $281,900
1003 Simpson St, Pensacola, FL 32526
--beds
7baths
1,887sqft
SingleFamily
Built in 1997
0.34 Acres Lot
$281,900 Zestimate®
$149/sqft
$-- HOA
Overview
- 107 days |
- 6 |
- 1 |
Facts & features
Interior
Bedrooms & bathrooms
- Bathrooms: 7
Heating
- Other
Cooling
- Central
Features
- Flooring: Other, Carpet, Linoleum / Vinyl
- Has fireplace: Yes
Interior area
- Total interior livable area: 1,887 sqft
Property
Parking
- Parking features: Garage - Attached
Features
- Exterior features: Other, Brick
Lot
- Size: 0.34 Acres
Details
- Parcel number: 391S311102002001
Construction
Type & style
- Home type: SingleFamily
Materials
- Wood
- Foundation: Slab
- Roof: Composition
Condition
- Year built: 1997
Community & HOA
Location
- Region: Pensacola
Financial & listing details
- Price per square foot: $149/sqft
- Tax assessed value: $216,893
- Annual tax amount: $2,931
Visit our professional directory to find a foreclosure specialist in your area that can help with your home search.
Find a foreclosure agentForeclosure details
Estimated market value
$281,900
$251,000 - $307,000
$2,214/mo
Price history
| Date | Event | Price |
|---|---|---|
| 8/27/1997 | Sold | $105,100$56/sqft |
Source: Public Record Report a problem | ||
Public tax history
| Year | Property taxes | Tax assessment |
|---|---|---|
| 2024 | $2,931 | $216,893 +3.7% |
| 2023 | -- | $209,125 +16.9% |
| 2022 | $1,046 +0.8% | $178,835 +20.3% |
| 2021 | $1,038 +2.6% | $148,640 +11% |
| 2020 | $1,012 +1.6% | $133,939 +5% |
| 2019 | $996 | $127,569 +27% |
| 2018 | $996 +0.5% | $100,477 +2.1% |
| 2017 | $991 +0.7% | $98,411 +2.1% |
| 2016 | $985 +1.2% | $96,387 +0.7% |
| 2015 | $973 | $95,717 +0.8% |
| 2014 | $973 | $94,958 +1.5% |
| 2013 | -- | $93,555 -0.9% |
| 2012 | -- | $94,412 -4.8% |
| 2011 | -- | $99,180 -4.4% |
| 2010 | -- | $103,693 +2.7% |
| 2009 | -- | $100,967 +0.1% |
| 2008 | -- | $100,867 +3% |
| 2007 | -- | $97,930 +2.5% |
| 2006 | -- | $95,550 +3% |
| 2005 | -- | $92,770 +3% |
| 2004 | -- | $90,070 +1.9% |
| 2003 | -- | $88,390 -4.3% |
| 2002 | -- | $92,330 +0.8% |
| 2001 | -- | $91,610 +2% |
| 2000 | -- | $89,830 +1% |
| 1999 | -- | $88,950 |
Find assessor info on the county website
Monthly payment
Estimated monthly payment$1,822
All calculations are estimates and provided by Zillow, Inc. for informational purposes only. Actual amounts may vary.
HOA fees may include property taxes on listings classified as Co-Ops. Contact the listing agent and/or owner for fee details.
Mortgage interest rates are dependent on a number of factors, including credit score, down payment, and repayment length. Interest rate data provided by Zillow Group Marketplace, Inc. as of 1/1/1970 from various mortgage lenders with which we have lead or other similar arrangements; the Estimated Payment is an average of those rates.
See how much you could borrow to make a competitive offer.
Climate risks
Neighborhood: 32526
Nearby schools
GreatSchools rating
- 3/10Longleaf Elementary SchoolGrades: PK-5Distance: 1.3 mi
- 2/10Bellview Middle SchoolGrades: 6-8Distance: 0.4 mi
- 2/10Pine Forest High SchoolGrades: 9-12Distance: 1.4 mi


- Florida
- Escambia County
- Pensacola
- 32526
- 1003 Simpson St
Nearby cities
Nearby neighborhoods
Nearby zip codes
Other Pensacola Topics
