This is a 1550 square foot, 2.0 bathroom, single family home. This home is located at 11081 70th Ave, Seminole, FL 33772.
Pre-foreclosure
Street View
Est. $369,500
11081 70th Ave, Seminole, FL 33772
--beds
2baths
1,550sqft
SingleFamily
Built in 1951
8,232 Square Feet Lot
$369,500 Zestimate®
$238/sqft
$307/mo HOA
Overview
- 295 days
- 27
- 4
Facts & features
Interior
Bedrooms & bathrooms
- Bathrooms: 2
Heating
- Wall
Cooling
- None
Features
- Flooring: Carpet, Linoleum / Vinyl
- Has fireplace: Yes
Interior area
- Total interior livable area: 1,550 sqft
Property
Features
- Exterior features: Stucco
- View description: None
Lot
- Size: 8,232 Square Feet
Details
- Parcel number: 273015707583002702
Construction
Type & style
- Home type: SingleFamily
Materials
- masonry
- Foundation: Footing
- Roof: Composition
Condition
- Year built: 1951
Community & HOA
HOA
- Has HOA: Yes
- HOA fee: $307 monthly
Location
- Region: Seminole
Financial & listing details
- Price per square foot: $238/sqft
- Tax assessed value: $262,067
- Annual tax amount: $4,319
Foreclosure details
Estimated market value
$369,500
$318,000 - $421,000
$2,551/mo
Price history
| Date | Event | Price |
|---|---|---|
| 2/17/2026 | Listing removed | $259,900$168/sqft |
Source:  Stellar MLS #TB8415895 Report a problem | ||
| 12/29/2025 | Pending sale | $259,900$168/sqft |
Source: Stellar MLS #TB8415895 Report a problem | ||
| 12/18/2025 | Price change | $259,900+6.1%$168/sqft |
Source: Stellar MLS #TB8415895 Report a problem | ||
| 11/24/2025 | Price change | $245,000-10.9%$158/sqft |
Source: Stellar MLS #TB8415895 Report a problem | ||
| 11/17/2025 | Listed for sale | $274,900$177/sqft |
Source: Stellar MLS #TB8415895 Report a problem | ||
| 11/7/2025 | Pending sale | $274,900$177/sqft |
Source: Stellar MLS #TB8415895 Report a problem | ||
| 10/15/2025 | Price change | $274,900-1.5%$177/sqft |
Source: Stellar MLS #TB8415895 Report a problem | ||
| 9/16/2025 | Price change | $279,000-3.5%$180/sqft |
Source: Stellar MLS #TB8415895 Report a problem | ||
| 9/10/2025 | Price change | $289,000-3.3%$186/sqft |
Source: Stellar MLS #TB8415895 Report a problem | ||
| 8/30/2025 | Price change | $299,000-5.1%$193/sqft |
Source: Stellar MLS #TB8415895 Report a problem | ||
| 8/24/2025 | Price change | $315,000-3.1%$203/sqft |
Source: Stellar MLS #TB8415895 Report a problem | ||
| 8/19/2025 | Price change | $325,000-4.4%$210/sqft |
Source: Stellar MLS #TB8415895 Report a problem | ||
| 8/16/2025 | Price change | $340,000-2.9%$219/sqft |
Source: Stellar MLS #TB8415895 Report a problem | ||
| 8/9/2025 | Listed for sale | $350,000+12.9%$226/sqft |
Source: Stellar MLS #TB8415895 Report a problem | ||
| 2/20/2025 | Sold | $310,000+31.9%$200/sqft |
Source: Public Record Report a problem | ||
| 7/24/2024 | Listing removed | $235,000-21.7%$152/sqft |
Source: Stellar MLS #U8127040 Report a problem | ||
| 12/26/2023 | Sold | $300,000-6.3%$194/sqft |
Source: Public Record Report a problem | ||
| 11/9/2023 | Listed for sale | $320,000+31.7%$206/sqft |
Source: Stellar MLS #T3485339 Report a problem | ||
| 7/23/2021 | Sold | $243,000+3.4%$157/sqft |
Source: Stellar MLS #U8127040 Report a problem | ||
| 6/20/2021 | Pending sale | $235,000$152/sqft |
Source: Stellar MLS #U8127040 Report a problem | ||
| 6/15/2021 | Listed for sale | $235,000+171.7%$152/sqft |
Source: Stellar MLS #U8127040 Report a problem | ||
| 4/25/2000 | Sold | $86,500$56/sqft |
Source: Public Record Report a problem | ||
Public tax history
| Year | Property taxes | Tax assessment |
|---|---|---|
| 2025 | $4,319 +12.9% | $262,067 +6.4% |
| 2024 | $3,826 +6.1% | $246,196 +8.4% |
| 2023 | $3,606 +7.3% | $227,214 +8.1% |
| 2022 | $3,361 +282.2% | $210,247 +125.3% |
| 2021 | $879 +0.9% | $93,310 +1.4% |
| 2020 | $871 +2.9% | $92,022 +2.3% |
| 2019 | $846 | $89,953 +1.9% |
| 2018 | $846 +2.3% | $88,276 +2.1% |
| 2017 | $827 +3.4% | $86,460 +2.1% |
| 2016 | $800 -1.9% | $84,682 +0.7% |
| 2015 | $816 +0.9% | $84,093 +0.8% |
| 2014 | $808 +1.3% | $83,426 +1.5% |
| 2013 | $798 +2.6% | $82,193 +1.7% |
| 2012 | $778 | $80,819 -9.7% |
| 2011 | -- | $89,526 +1.5% |
| 2010 | -- | $88,203 +2.7% |
| 2009 | -- | $85,884 +0.1% |
| 2008 | $850 | $85,798 +3% |
| 2007 | -- | $83,299 -29.6% |
| 2005 | -- | $118,400 +15.5% |
| 2004 | $1,040 +2.2% | $102,500 +11.5% |
| 2003 | $1,018 +4.6% | $91,900 +8.9% |
| 2002 | $973 | $84,400 +16.6% |
| 2001 | $973 -20.7% | $72,400 +22.1% |
| 2000 | $1,228 | $59,300 |
Find assessor info on the county website
Monthly payment
Climate risks
Neighborhood: 33772
Similar homes
- $360,0003 bd2 ba1.5k sqft11428 75TH AVENUE, SEMINOLE, FL 33772For Sale

 MLS ID #O6428213, Jeff Jones, MARK SPAIN REAL ESTATE. Stellar MLS
- $365,0003 bd2 ba1.1k sqft11401 81ST AVENUE, SEMINOLE, FL 33772For Sale
 MLS ID #TB8561997, Michelle Cline, PA, RE/MAX ACTION FIRST OF FLORIDA. Stellar MLS
- $379,9002 bd2 ba1.1k sqft10927 72ND AVENUE, SEMINOLE, FL 33772For Sale
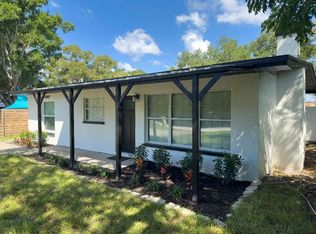 MLS ID #TB8554487, Stephen Hachey, FLAT FEE MLS REALTY. Stellar MLS
- $375,0003 bd2 ba1.1k sqft11442 86TH AVENUE, SEMINOLE, FL 33772For Sale
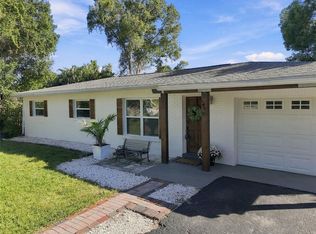 MLS ID #TB8556455, Beth Ann Ackerman, REALTY EXPERTS. Stellar MLS
- $339,9003 bd1 ba1k sqft10735 63RD AVENUE, SEMINOLE, FL 33772For SaleMLS ID #TB8553202, Drew Moser, EXP REALTY LLC. Stellar MLS
- $359,9002 bd2 ba991 sqft11324 87TH AVENUE, SEMINOLE, FL 33772For SaleMLS ID #TB8545854, Alexandra Sirabella, CENTURY 21 RE CHAMPIONS. Stellar MLS
- $425,0003 bd2 ba1.3k sqft11373 67TH AVENUE, SEMINOLE, FL 33772For SaleMLS ID #TB8536599, Laura Feliciano, KELLER WILLIAMS REALTY PORTFOLIO COLLECTION. Stellar MLS
- $399,9002 bd2 ba1.2k sqft11450 80TH AVENUE, SEMINOLE, FL 33772For SaleMLS ID #TB8537044, Kathleen Williams, ROE REALTY. Stellar MLS
- $400,0003 bd2 ba1.3k sqft9270 111TH STREET, SEMINOLE, FL 33772For SaleMLS ID #TB8558318, Brett Tesney, CHARLES RUTENBERG REALTY INC. Stellar MLS
- $449,0004 bd2 ba2.2k sqft7192 114TH LANE, SEMINOLE, FL 33772For SaleMLS ID #O6449182, Steven Koleno, BEYCOME OF FLORIDA LLC. Stellar MLS
- $359,0002 bd1 ba1k sqft11365 81ST AVENUE, SEMINOLE, FL 33772For SaleMLS ID #TB8552223, Nick Wimperis, LPT REALTY, LLC. Stellar MLS
- $400,0003 bd2 ba1.4k sqft11615 PARK BOULEVARD, SEMINOLE, FL 33772For SaleMLS ID #TB8459949, Jodi Avery, KELLER WILLIAMS SOUTH TAMPA. Stellar MLS
- $420,0004 bd2 ba1.3k sqft10259 NARANJA STREET, SEMINOLE, FL 33772For SaleMLS ID #TB8551434, Meredith Johnson, REALTY EXPERTS. Stellar MLS
- $385,0002 bd1 ba1k sqft8001 RIDGE ROAD, SEMINOLE, FL 33772For SaleMLS ID #TB8558761, Taylor Welch, COMPASS FLORIDA LLC. Stellar MLS
- $359,0002 bd1 ba850 sqft10473 CIRIMOYA LANE, SEMINOLE, FL 33772For SaleMLS ID #TB8553171, Paris Faughn, CENTURY 21 BEGGINS. Stellar MLS
- $345,0002 bd1 ba875 sqft6522 112TH STREET, SEMINOLE, FL 33772For SaleMLS ID #TB8510095, Christina Smarowsky, DALTON WADE INC. Stellar MLS
- $339,0002 bd1 ba1.1k sqft9371 110TH STREET, SEMINOLE, FL 33772For SaleMLS ID #TB8558512, Carol Conologue, KELLER WILLIAMS REALTY- PALM HARBOR. Stellar MLS
- $459,0003 bd2 ba1.5k sqft5441 113TH STREET, SEMINOLE, FL 33772For SaleMLS ID #A4708704, Marty Garcia, BERKSHIRE HATHAWAY HOMESERVICE. Stellar MLS
- $290,0003 bd2 ba1.2k sqft8825 113TH STREET, SEMINOLE, FL 33772For SaleMLS ID #TB8557936, Krystle Gordon, SPIN REAL ESTATE LLC. Stellar MLS
- $525,0003 bd2 ba1.5k sqft5795 HILLSIDE STREET, SEMINOLE, FL 33772For SaleMLS ID #O6452414, Eva Hockenberry, MAINSTAY BROKERAGE LLC. Stellar MLS
