$197,000
4 bd|2 ba|1.4k sqft
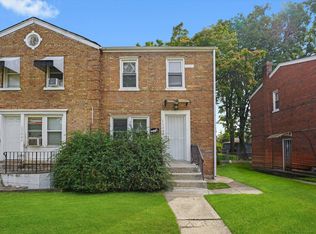
11319 S Carpenter St, Chicago, IL 60643
Sold
Zillow last checked:
Listing updated:
Margaret Bolatito Adebayo (708)855-4628,
Real People Realty
Not available
Estimated sales range
Not available
$2,594/mo
| Date | Event | Price |
|---|---|---|
| 6/15/2026 | Listed for sale | $220,000+560%$196/sqft |
Source: MRED as distributed by MLS GRID #12677976 Report a problem | ||
| 3/31/2020 | Listing removed | $33,333$30/sqft |
Source: Coldwell Banker Residential #10355833 Report a problem | ||
| 9/6/2019 | Price change | $33,333-32.4%$30/sqft |
Source: Coldwell Banker Residential Brokerage - Hyde Park #10355833 Report a problem | ||
| 5/10/2019 | Listed for sale | $49,333$44/sqft |
Source: Coldwell Banker Residential Brokerage - Hyde Park #10355833 Report a problem | ||
| 4/29/2019 | Pending sale | $49,333$44/sqft |
Source: Coldwell Banker Residential Brokerage - Hyde Park #10355833 Report a problem | ||
| 4/25/2019 | Listed for sale | $49,333+419.3%$44/sqft |
Source: Coldwell Banker Residential #10355833 Report a problem | ||
| 2/18/2019 | Listing removed | $900$1/sqft |
Source: Coldwell Banker Residential #10017791 Report a problem | ||
| 7/14/2018 | Listed for rent | $900$1/sqft |
Source: Coldwell Banker Residential Brokerage - Hyde Park #10017791 Report a problem | ||
| 4/20/2010 | Sold | $9,500-26.4%$8/sqft |
Source: | ||
| 1/29/2010 | Listed for sale | $12,900-90.4%$11/sqft |
Source: TheListingWidget.com #07424432 Report a problem | ||
| 2/3/2005 | Sold | $135,000+159.6%$120/sqft |
Source: Public Record Report a problem | ||
| 12/29/2004 | Sold | $52,000$46/sqft |
Source: Public Record Report a problem | ||
| Year | Property taxes | Tax assessment |
|---|---|---|
| 2024 | -- | $5,400 +43.2% |
| 2023 | $798 +2.5% | $3,772 |
| 2022 | $778 +2.3% | $3,772 |
| 2021 | $761 -46% | $3,772 -40.2% |
| 2020 | $1,408 +0.9% | $6,303 -9% |
| 2019 | $1,395 +1.7% | $6,927 |
| 2018 | $1,372 -8.9% | $6,927 -0.8% |
| 2017 | $1,506 +7.5% | $6,982 |
| 2016 | $1,402 +9.3% | $6,982 |
| 2015 | $1,283 +9.3% | $6,982 +10.7% |
| 2014 | $1,173 +2% | $6,308 |
| 2013 | $1,150 +1.4% | $6,308 |
| 2012 | $1,134 -11.2% | $6,308 -19.8% |
| 2011 | $1,277 -0.4% | $7,862 |
| 2010 | $1,282 +4.4% | $7,862 |
| 2009 | $1,228 +217.7% | $7,862 -16.4% |
| 2008 | $387 +6.2% | $9,405 |
| 2007 | $364 +0.8% | $9,405 |
| 2006 | $361 -5.2% | $9,405 +46.4% |
| 2005 | $381 +1.9% | $6,426 |
| 2004 | $374 +4.4% | $6,426 |
| 2003 | $358 -5.4% | $6,426 +63.7% |
| 2002 | $378 +14.7% | $3,926 |
| 2001 | $330 -52.5% | $3,926 |
| 2000 | $695 +132% | $3,926 +8.8% |
| 1999 | $299 | $3,610 |
Find assessor info on the county website
Source: MRED as distributed by MLS GRID. This data may not be complete. We recommend contacting the local school district to confirm school assignments for this home.
A local agent can set up tours, give advice and negotiate with sellers.