This 2182 square foot single family home has 3 bedrooms and 2.0 bathrooms. This home is located at 11323 N Rome Ave, Tampa, FL 33612.
Pre-foreclosure
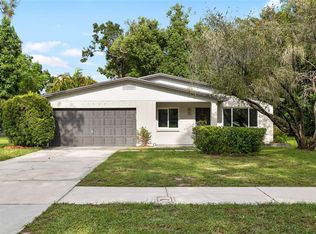
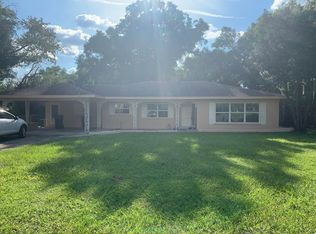
Street View
Est. $380,200
11323 N Rome Ave, Tampa, FL 33612
3beds
2baths
2,182sqft
SingleFamily
Built in 1957
0.29 Acres Lot
$380,200 Zestimate®
$174/sqft
$-- HOA
Overview
- 21 days |
- 35 |
- 1 |
Facts & features
Interior
Bedrooms & bathrooms
- Bedrooms: 3
- Bathrooms: 2
Heating
- Other
Cooling
- Central
Features
- Flooring: Other, Concrete, Hardwood, Linoleum / Vinyl
- Has fireplace: Yes
Interior area
- Total interior livable area: 2,182 sqft
Property
Parking
- Parking features: Carport
Features
- Exterior features: Wood
Lot
- Size: 0.29 Acres
Details
- Parcel number: 1828143D6000053000300A
Construction
Type & style
- Home type: SingleFamily
Materials
- masonry
- Roof: Composition
Condition
- Year built: 1957
Community & HOA
Location
- Region: Tampa
Financial & listing details
- Price per square foot: $174/sqft
- Tax assessed value: $320,672
- Annual tax amount: $6,648
Visit our professional directory to find a foreclosure specialist in your area that can help with your home search.
Find a foreclosure agentForeclosure details
Estimated market value
$380,200
$335,000 - $418,000
$2,998/mo
Price history
Price history is unavailable.
Public tax history
| Year | Property taxes | Tax assessment |
|---|---|---|
| 2025 | $6,648 +10% | $320,672 +6.8% |
| 2024 | $6,044 +6.3% | $300,116 +10% |
| 2023 | $5,683 +6.2% | $272,833 +10% |
| 2022 | $5,352 +13.2% | $248,030 +10% |
| 2021 | $4,729 +421.7% | $225,482 +101.9% |
| 2020 | $907 +2.8% | $111,667 +2.3% |
| 2019 | $882 | $109,156 +1.9% |
| 2018 | $882 +1% | $107,121 -26.4% |
| 2017 | $873 +64.3% | $145,531 +91.8% |
| 2016 | $532 +0.9% | $75,877 +0.7% |
| 2015 | $527 +17.2% | $75,350 +0.8% |
| 2014 | $450 | $74,752 +1.5% |
| 2013 | $450 -2.1% | $73,647 +1.7% |
| 2012 | $459 -17.9% | $72,416 -9.6% |
| 2011 | $560 -9.4% | $80,110 -5.3% |
| 2010 | $618 +4.8% | $84,573 +2.7% |
| 2009 | $589 -0.7% | $82,350 +0.1% |
| 2008 | $593 -35.1% | $82,268 +3% |
| 2007 | $914 -2.9% | $79,872 +2.5% |
| 2006 | $941 +3.4% | $77,924 +3% |
| 2005 | $910 | $75,654 +3% |
| 2004 | -- | $73,450 +1.9% |
| 2003 | -- | $72,080 +2.4% |
| 2002 | -- | $70,391 +1.6% |
| 2001 | -- | $69,282 -16.8% |
| 2000 | $1,078 | $83,226 |
Find assessor info on the county website
Monthly payment
Estimated monthly payment$1,822
All calculations are estimates and provided by Zillow, Inc. for informational purposes only. Actual amounts may vary.
HOA fees may include property taxes on listings classified as Co-Ops. Contact the listing agent and/or owner for fee details.
Mortgage interest rates are dependent on a number of factors, including credit score, down payment, and repayment length. Interest rate data provided by Zillow Group Marketplace, Inc. as of 1/1/1970 from various mortgage lenders with which we have lead or other similar arrangements; the Estimated Payment is an average of those rates.
See how much you could borrow to make a competitive offer.
Climate risks
Neighborhood: Forest Hills
Getting around
15 / 100
Minimal TransitNearby schools
GreatSchools rating
- 6/10Lake Magdalene Elementary SchoolGrades: PK-5Distance: 0.4 mi
- 6/10Hill Middle SchoolGrades: 6-8Distance: 4.3 mi
- 2/10Chamberlain High SchoolGrades: 9-12Distance: 1.3 mi


- Florida
- Hillsborough County
- Tampa
- 33612
- Forest Hills
- 11323 N Rome Ave
Nearby cities
Nearby neighborhoods
Nearby zip codes
Other Tampa Topics
