Property sold As is without repairs or warranty.
Pre-foreclosure
Est. $362,500
1136 Tyler Lake Cir, Orlando, FL 32839
3beds
2baths
1,577sqft
SingleFamily
Built in 1991
5,509 Square Feet Lot
$362,500 Zestimate®
$230/sqft
$241/mo HOA
Overview
- 85 days
- 9
- 0
Facts & features
Interior
Bedrooms & bathrooms
- Bedrooms: 3
- Bathrooms: 2
Heating
- Forced air
Cooling
- Central
Interior area
- Total interior livable area: 1,577 sqft
Property
Parking
- Parking features: Garage
Lot
- Size: 5,509 Square Feet
Details
- Parcel number: 292314367300290
Construction
Type & style
- Home type: SingleFamily
Materials
- masonry
- Roof: Composition
Condition
- Year built: 1991
Community & HOA
HOA
- Has HOA: Yes
- HOA fee: $241 monthly
Location
- Region: Orlando
Financial & listing details
- Price per square foot: $230/sqft
- Tax assessed value: $322,048
- Annual tax amount: $5,217
Foreclosure details
Estimated market value
$362,500
$344,000 - $381,000
$2,301/mo
Price history
| Date | Event | Price |
|---|---|---|
| 11/19/2019 | Sold | $239,000+178.4%$152/sqft |
Source: Public Record Report a problem | ||
| 3/23/2011 | Sold | $85,860+4.7%$54/sqft |
Source: Public Record Report a problem | ||
| 11/19/2010 | Listing removed | $82,000$52/sqft |
Source: Altisource Homes #O4988220 Report a problem | ||
| 11/14/2010 | Price change | $82,000+29.1%$52/sqft |
Source: Altisource Homes #O4988220 Report a problem | ||
| 11/5/2010 | Price change | $63,530+12.4%$40/sqft |
Source: Altisource Homes #O4988220 Report a problem | ||
| 11/3/2010 | Price change | $56,530+2.7%$36/sqft |
Source: Altisource Homes #O4988220 Report a problem | ||
| 10/23/2010 | Price change | $55,030+0.9%$35/sqft |
Source: Altisource Homes #O4988220 Report a problem | ||
| 10/22/2010 | Price change | $54,530-45.4%$35/sqft |
Source: Altisource Homes #O4988220 Report a problem | ||
| 8/27/2010 | Price change | $99,900-4.8%$63/sqft |
Source: Altisource Homes #O4988220 Report a problem | ||
| 8/8/2010 | Price change | $104,900-4.5%$67/sqft |
Source: Altisource Homes #O4988220 Report a problem | ||
| 6/26/2010 | Price change | $109,900+5.3%$70/sqft |
Source: Altisource Portfolio Solutions #O4988220 Report a problem | ||
| 6/19/2010 | Listed for sale | $104,405-0.6%$66/sqft |
Source: Altisource Portfolio Solutions Report a problem | ||
| 12/21/1998 | Sold | $105,000$67/sqft |
Source: Public Record Report a problem | ||
Public tax history
| Year | Property taxes | Tax assessment |
|---|---|---|
| 2024 | $5,217 +11.6% | $278,295 +10% |
| 2023 | $4,675 +16% | $252,995 +10% |
| 2022 | $4,031 +9.3% | $229,995 +10% |
| 2021 | $3,687 +2.9% | $209,086 +4.3% |
| 2020 | $3,583 +85.8% | $200,465 +48.4% |
| 2019 | $1,928 +1.6% | $135,080 +1.9% |
| 2018 | $1,899 | $132,561 -13.3% |
| 2017 | $1,899 +2.2% | $152,923 +5.2% |
| 2016 | $1,857 +1.7% | $145,341 +15.1% |
| 2015 | $1,827 -20.8% | $126,280 +4.3% |
| 2014 | $2,307 +17.1% | $121,126 +31.7% |
| 2013 | $1,970 +0.3% | $91,982 +1.3% |
| 2012 | $1,964 -2% | $90,827 -2.3% |
| 2011 | $2,003 -5.1% | $92,955 -9.2% |
| 2010 | $2,110 | $102,358 -13.1% |
| 2009 | -- | $117,774 -40.3% |
| 2008 | $3,573 -5.3% | $197,263 -7.5% |
| 2007 | $3,772 +117.1% | $213,313 +16.3% |
| 2006 | $1,738 +2.3% | $183,452 +48.2% |
| 2005 | $1,698 +4.9% | $123,786 +15.2% |
| 2004 | $1,619 +0.9% | $107,488 -3.6% |
| 2003 | $1,604 +3.2% | $111,525 +9.7% |
| 2002 | $1,555 -1.1% | $101,685 +7.6% |
| 2001 | $1,572 -21.4% | $94,467 +4% |
| 2000 | $2,000 | $90,826 |
Find assessor info on the county website
Monthly payment
Climate risks
Neighborhood: 32839
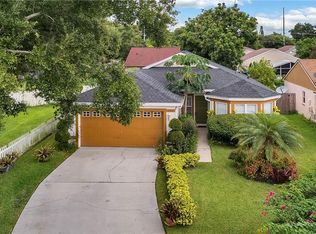

Similar homes
- $345,0003 bd2 ba1.1k sqft1118 43RD STREET, ORLANDO, FL 32839For Sale

 MLS ID #S5159604, Yanou Rosado, KELLER WILLIAMS CLASSIC. Stellar MLS
- $330,0003 bd2 ba1.1k sqft2039 BLOSSOM TER, ORLANDO, FL 32839For Sale
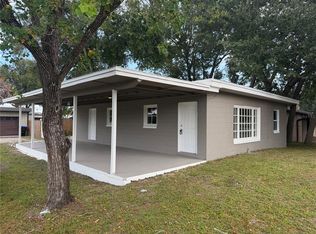 MLS ID #S5160739, Perry Taveras, FLEURYS INVESTMENTS LLC. Stellar MLS
- $349,9004 bd2 ba1.2k sqft5425 WINTER RUN DRIVE, ORLANDO, FL 32839For Sale
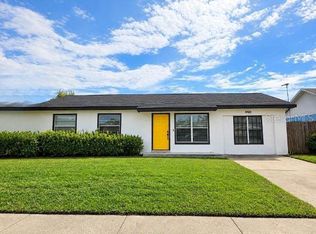 MLS ID #O6452895, Phyllis Au-Yang, MAKTUB REALTY. Stellar MLS
- $419,9003 bd2 ba1.2k sqft303 HALSEY STREET, ORLANDO, FL 32839For Sale
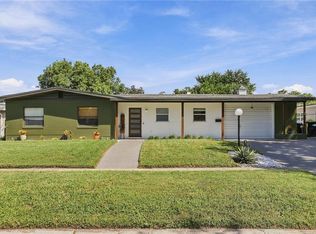 MLS ID #O6441945, Paul Giles, COMPASS FLORIDA LLC. Stellar MLS
- $374,9993 bd2 ba1.5k sqft5409 STRATEMEYER DRIVE, ORLANDO, FL 32839For SaleMLS ID #G5113682, Tamara Quilling, COLDWELL BANKER HUBBARD HANSEN. Stellar MLS
- $355,0003 bd2 ba1.3k sqft123 E LAKE MARY DRIVE, ORLANDO, FL 32839For SaleMLS ID #O6424265, Alejandro Colon Ortega, PREFERRED REAL ESTATE BROKERS. Stellar MLS
- $299,9003 bd3 ba1.5k sqft4103 S NASHVILLE AVENUE, ORLANDO, FL 32839For SaleMLS ID #O6452198, Robert Salmons, ENTERA REALTY LLC. Stellar MLS
- $315,0003 bd2 ba1.5k sqft1824 37TH STREET, ORLANDO, FL 32839For SaleMLS ID #O6436152, Patricia Padron, PROPERTY PARTNERS REALTY INC. Stellar MLS
- $364,9993 bd2 ba1.1k sqft777 28TH STREET, ORLANDO, FL 32805For SaleMLS ID #O6426395, Mirtha Nahmens, CASSA REALTY CORP. Stellar MLS
- $314,9002 bd1 ba1k sqft5465 LAKE TYNER DRIVE, ORLANDO, FL 32839For SaleMLS ID #O6449674, Kristy McKay, KELLER WILLIAMS REALTY AT THE PARKS. Stellar MLS
- $345,0003 bd2 ba1.4k sqft1336 40TH STREET, ORLANDO, FL 32839New ConstructionMLS ID #O6448633, Paulette Williams, KEYSTONE GLOBAL REAL ESTATE LLC. Stellar MLS
- $310,0003 bd2 ba1.1k sqft5003 AVENTURA BOULEVARD, ORLANDO, FL 32839For SaleMLS ID #O6387582, Lisena Piquant, CENTURY 21 CARIOTI. Stellar MLS
- $398,0003 bd2 ba1.3k sqft2780 PASEO AVENUE, ORLANDO, FL 32805For SaleMLS ID #O6421414, Bryan Burns, RE/MAX DOWNTOWN. Stellar MLS
- $369,0004 bd2 ba1.7k sqft3120 TRADEWINDS TRAIL, ORLANDO, FL 32805For SaleMLS ID #O6436475, Missy Tift, WEICHERT REALTORS HALLMARK PRO. Stellar MLS
- $459,9004 bd2 ba1.7k sqft644 VISCAYA AVENUE, ORLANDO, FL 32839For SaleMLS ID #P4939011, Christopher Piasczyk, EXP REALTY LLC. Stellar MLS
- $299,9903 bd1 ba1k sqft5620 SANDALWOOD DRIVE, ORLANDO, FL 32839For SaleMLS ID #O6450371, Jenaia Fowlkes, FOWLKES REALTY CO. Stellar MLS
- $390,0003 bd2 ba1.1k sqft2605 CHAR STREET, ORLANDO, FL 32839For SaleMLS ID #O6435976, Marilene Auge, CHARLES RUTENBERG REALTY ORLANDO. Stellar MLS
- $345,0003 bd2 ba1.4k sqft1320 40TH STREET, ORLANDO, FL 32839New ConstructionMLS ID #O6448621, Paulette Williams, KEYSTONE GLOBAL REAL ESTATE LLC. Stellar MLS
- $375,0003 bd2 ba1.2k sqft410 E CRYSTAL LAKE STREET, ORLANDO, FL 32806For SaleMLS ID #O6372531, German Martinez, KELLER WILLIAMS ADVANTAGE 2 REALTY. Stellar MLS
