Beautiful 3 bedroom acreage sitting along Dubuque rd. (2 lane hwy.20). In Blackhawk County just 15 miles from Waterloo and 2.5 miles to Jesup. It has 4.91 acres with 0.85 acres R.O.W. New septic system put in fall of 2025. This property has continuous fencing with a heated automatic watered in back building for horses/cattle. Call 319-239-0973 to come take a look
For sale by owner
$515,000
11403 Dubuque Rd, Jesup, IA 50648
3beds
2,335sqft
SingleFamily
Built in 1920
4.06 Acres Lot
$381,400 Zestimate®
$221/sqft
$-- HOA
What's special
Continuous fencing
- 2 days
- 264
- 16
Listed by:
Property Owner (319) 239-0973
Facts & features
Interior
Bedrooms & bathrooms
- Bedrooms: 3
- Bathrooms: 2
- Full bathrooms: 2
Heating
- Other, Other
Cooling
- Other
Features
- Flooring: Tile, Carpet
- Basement: Partially finished
Interior area
- Total interior livable area: 2,335 sqft
Property
Parking
- Parking features: Garage - Detached
Features
- Exterior features: Other
Lot
- Size: 4.06 Acres
Details
- Parcel number: 891135376003
Construction
Type & style
- Home type: SingleFamily
Materials
- Frame
- Foundation: Concrete Block
- Roof: Metal
Condition
- New construction: No
- Year built: 1920
Community & HOA
Location
- Region: Jesup
Financial & listing details
- Price per square foot: $221/sqft
- Tax assessed value: $376,770
- Annual tax amount: $3,959
- Date on market: 11/9/2026
Estimated market value
$381,400
$317,000 - $450,000
Not available
Price history
| Date | Event | Price |
|---|---|---|
| 11/9/2026 | Listed for sale | $515,000+586.7%$221/sqft |
Source: Owner Report a problem | ||
| 12/18/1998 | Sold | $75,000$32/sqft |
Source: Agent Provided Report a problem | ||
Public tax history
| Year | Property taxes | Tax assessment |
|---|---|---|
| 2025 | $3,959 +0.4% | $376,770 +10.7% |
| 2024 | $3,943 +17.6% | $340,210 |
| 2023 | $3,354 +2.2% | $340,210 +39% |
| 2022 | $3,281 -1% | $244,780 |
| 2021 | $3,314 +0.8% | $244,780 +4.7% |
| 2020 | $3,288 -2.1% | $233,780 |
| 2019 | $3,358 +19.9% | $233,780 +0.8% |
| 2018 | $2,801 0% | $231,940 +17.2% |
| 2017 | $2,802 +6% | $197,840 -0.2% |
| 2016 | $2,644 | $198,250 |
| 2015 | $2,644 +7% | $198,250 |
| 2014 | $2,472 +1.5% | $198,250 |
| 2012 | $2,435 +20.2% | $198,250 |
| 2011 | $2,026 +7.7% | $198,250 +14.7% |
| 2010 | $1,881 +3.6% | $172,840 |
| 2009 | $1,816 +2.3% | $172,840 |
| 2008 | $1,774 +15.2% | $172,840 +7% |
| 2007 | $1,540 -2% | $161,530 |
| 2006 | $1,572 +57.6% | $161,530 |
| 2005 | $997 +9.7% | $161,530 +86% |
| 2003 | $909 +1.8% | $86,840 |
| 2002 | $893 -8.5% | $86,840 +18% |
| 2001 | $977 | $73,590 |
Find assessor info on the county website
Monthly payment
Est. payment
Payment breakdown
Explore the cost of this home by adjusting the details. Changes won't be saved.Climate risks
Neighborhood: 50648


Similar homes
- $529,0006 bd4 ba3.4k sqft155 W Ann St, Jesup, IA 50648For Sale
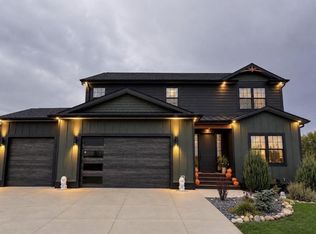 MLS ID #20265272, Brittany D Wilson, EXP Realty, LLC. Northeast Iowa Regional BOR as distributed by MLS GRID
- $369,9005 bd3 ba2.4k sqft1144 Hawley St, Jesup, IA 50648For Sale
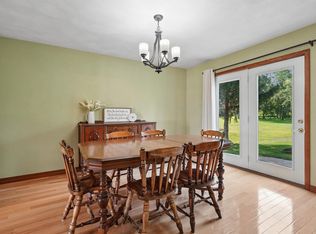 MLS ID #20264416, Kelly L Walton, Ohl Iowa Realty, Inc. Northeast Iowa Regional BOR as distributed by MLS GRID
- $360,0003 bd3 ba3.2k sqft1234 10th St, Jesup, IA 50648For Sale
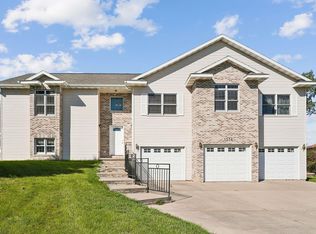 MLS ID #20265181, Britley J Beck, Century 21 Signature RE Hiawatha. Northeast Iowa Regional BOR as distributed by MLS GRID
- $499,0004 bd3 ba3.4k sqft1808 Timberline Dr, Evansdale, IA 50707For Sale
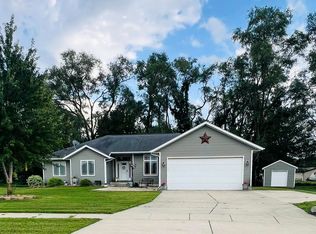 MLS ID #20265416, Cindy Gaffney, Re/Max Concepts. Northeast Iowa Regional BOR as distributed by MLS GRID
