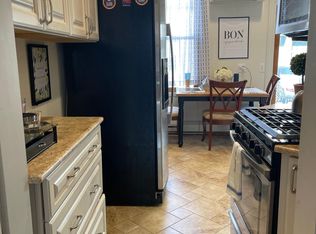
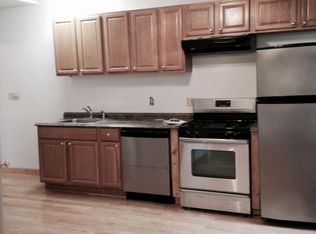
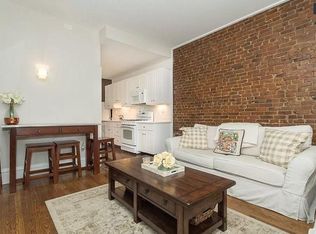
Rarely available two-family on South Boston's East Side, steps from East Broadway and M Street Beach. Unit 1 is a 1-bed, 1-bath with a finished lower level that offers real potential for the next owner, including a full walkout to the street, a rear patio, and full-size laundry. Two heat sources: gas hot-water baseboard and ductless mini-splits. Currently under-rented at $2,450 to a tenant-at-will. Unit 2 is a 4-bed, 1.5-bath duplex, updated throughout with a modern kitchen, in-unit laundry, a heated floor in the main bath, and a private rear deck. Same two heat sources, plus Andersen windows and doors. Leased to three tenants through August 31, 2027 at $4,475. Value-add potential to grow the rent roll as-is or with minor renovations.
For sale
Price cut: $40K (10/12)
$1,235,000
119 M St, South Boston, MA 02127
5beds
2,489sqft
Multi Family
Built in 1900
-- sqft lot
$1,120,200 Zestimate®
$496/sqft
$-- HOA
What's special
Full-size laundryIn-unit laundryPrivate rear deckRear patioFinished lower levelAndersen windows and doors
- 19 days
- 972
- 57
Zillow last checked:
Listing updated:
Listed by:
GPG Team 617-812-9035,
Grove Property Group 617-812-9035
Source: MLS PIN,MLS#: 73584840
Facts & features
Interior
Bedrooms & bathrooms
- Bedrooms: 5
- Bathrooms: 3
- Full bathrooms: 2
- 1/2 bathrooms: 1
Heating
- Hot Water, Steam
Cooling
- None
Features
- Basement: Partially Finished
- Has fireplace: No
Interior area
- Total structure area: 2,489
- Total interior livable area: 2,489 sqft
- Finished area above ground: 1,989
- Finished area below ground: 500
Property
Features
- Waterfront features: 0 to 1/10 Mile To Beach
Lot
- Size: 1,001 Square Feet
- Features: Other
Details
- Parcel number: 0602547000,1411511
- Zoning: res
Construction
Type & style
- Home type: MultiFamily
- Property subtype: Multi Family
Materials
- Foundation: Other
- Roof: Slate
Condition
- Year built: 1900
Utilities & green energy
- Sewer: Public Sewer
- Water: Public
Community & HOA
Location
- Region: South Boston
Financial & listing details
- Price per square foot: $496/sqft
- Tax assessed value: $1,158,800
- Annual tax amount: $14,369
- Date on market: 9/30/2026
- Total actual rent: 6925
Estimated market value
$1,120,200
$1.02M - $1.24M
$2,922/mo
Price history
| Date | Event | Price |
|---|---|---|
| 10/12/2026 | Price change | $1,235,000-3.1%$496/sqft |
Source: MLS PIN #73584840 Report a problem | ||
| 9/30/2026 | Listed for sale | $1,275,000+113.9%$512/sqft |
Source: MLS PIN #73584840 Report a problem | ||
| 10/6/2019 | Listing removed | $2,250$1/sqft |
Source: Zillow Rental Manager Report a problem | ||
| 10/2/2019 | Listed for rent | $2,250$1/sqft |
Source: Zillow Rental Manager Report a problem | ||
| 6/21/2013 | Sold | $596,000$239/sqft |
Source: Public Record Report a problem | ||
Public tax history
| Year | Property taxes | Tax assessment |
|---|---|---|
| 2025 | $12,659 +16% | $1,093,200 +9.2% |
| 2024 | $10,912 +9.6% | $1,001,100 +8% |
| 2023 | $9,956 +6.7% | $927,000 +8% |
| 2022 | $9,335 +4% | $858,000 +2% |
| 2021 | $8,976 +6% | $841,200 +4.9% |
| 2020 | $8,467 +2.2% | $801,800 +2% |
| 2019 | $8,287 +5.6% | $786,200 +5% |
| 2018 | $7,844 +361.8% | $748,500 +10% |
| 2017 | $1,699 -75% | $680,500 +10.2% |
| 2016 | $6,795 +11.7% | $617,700 +22.9% |
| 2015 | $6,084 +17% | $502,400 +26.9% |
| 2013 | $5,202 +8.6% | $395,900 +7.8% |
| 2012 | $4,788 +4% | $367,200 +2% |
| 2011 | $4,603 +6.6% | $359,900 -1% |
| 2010 | $4,318 +5.4% | $363,500 -5.7% |
| 2009 | $4,098 -8% | $385,500 -5% |
| 2008 | $4,453 -9.2% | $405,900 -9.1% |
| 2007 | $4,905 | $446,300 |
Find assessor info on the county website
Monthly payment
Est. payment
Payment breakdown
Explore the cost of this home by adjusting the details. Changes won't be saved.Climate risks
Neighborhood: South Boston

Similar homes
- $1,225,0004 bd3 ba1.4k sqft519 E 5th St #0, Boston, MA 02127For Sale
 MLS ID #73590119, Mary Kelly, Century 21 Property Central Inc.. MLS PIN
- $1,225,0004 bd3 ba1.4k sqft519 E 5th St, South Boston, MA 02127For Sale
 MLS ID #73574229, Mary Kelly, Century 21 Property Central Inc.. MLS PIN
- $1,325,0003 bd3 ba2.1k sqft14 Beckler Ave, South Boston, MA 02127For Sale
 MLS ID #73585044, Dom Lange, Gibson Sotheby's International Realty. MLS PIN
- $1,349,0004 bd3 ba2.5k sqft140 Athens St, South Boston, MA 02127For Sale
 MLS ID #73580744, Tana Bramley, Boston Realty Advisors. MLS PIN
