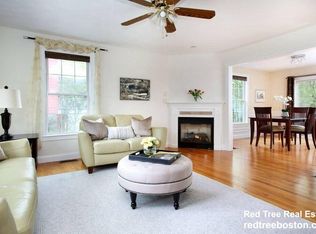
Sun-filled and spacious, this 4-level townhouse near Oak Square offers 3 bedrooms, 2.5 baths and approx. 2,208 sq ft on the Brighton/Newton line. The main level features a living room with gas fireplace, a half bath, and a dining area with wainscoting and glass sliders to a private deck. The kitchen includes granite countertops, a tiled backsplash and white shaker cabinets. Upstairs are two bedrooms and a full bath, with a private primary suite on the top floor. The finished walk-out basement includes laundry and garage access. Central air (HVAC updated 2019), hardwood floors, ample closets and 3 parking spaces complete the home. Oak Square shops, MBTA bus routes and the Mass Pike are all close by.
For sale
$1,050,000
121 Nonantum St #B, Brighton, MA 02135
3beds
2,208sqft
Condominium, Townhouse
Built in 2002
2,928 Square Feet Lot
$1,024,000 Zestimate®
$476/sqft
$-- HOA
What's special
Private deckLaundry and garage accessFinished walk-out basementHardwood floorsWhite shaker cabinetsAmple closetsSun-filled and spacious
- 25 days
- 358
- 19
Zillow last checked:
Listing updated:
Listed by:
William Morley 781-843-2996,
Martin Property Management 617-957-0166,
Scott Martin 617-957-0166
Source: MLS PIN,MLS#: 73591689
Facts & features
Interior
Bedrooms & bathrooms
- Bedrooms: 3
- Bathrooms: 3
- Full bathrooms: 2
- 1/2 bathrooms: 1
Primary bedroom
- Level: Third
Bedroom 2
- Level: Second
Bedroom 3
- Level: Second
Bathroom 1
- Level: First
Bathroom 2
- Level: Second
Bathroom 3
- Level: Third
Dining room
- Level: First
Family room
- Level: Basement
Kitchen
- Level: First
Living room
- Level: First
Heating
- Forced Air, Natural Gas
Cooling
- Central Air
Appliances
- Included: Range, Dishwasher, Refrigerator
- Laundry: In Basement, In Unit
Features
- Flooring: Wood, Tile
- Has basement: Yes
- Has fireplace: No
Interior area
- Total structure area: 2,208
- Total interior livable area: 2,208 sqft
- Finished area above ground: 2,208
- Finished area below ground: 476
Property
Parking
- Total spaces: 5
- Parking features: Attached, Under, Off Street
- Attached garage spaces: 1
- Uncovered spaces: 4
Features
- Patio & porch: Porch, Deck - Composite
- Exterior features: Porch, Deck - Composite
Lot
- Size: 2,928 Square Feet
Details
- Parcel number: W:22 P:03795 S:004,4440025
- Zoning: CD
Construction
Type & style
- Home type: Townhouse
- Property subtype: Condominium, Townhouse
Materials
- Frame
- Roof: Shingle
Condition
- Year built: 2002
Utilities & green energy
- Sewer: Public Sewer
- Water: Public
Community & HOA
Community
- Features: Public Transportation, Shopping, Park, Medical Facility, Highway Access, Private School, Public School
Location
- Region: Brighton
Financial & listing details
- Price per square foot: $476/sqft
- Tax assessed value: $890,300
- Annual tax amount: $11,040
- Date on market: 10/16/2026
Estimated market value
$1,024,000
$973,000 - $1.08M
$4,601/mo
Price history
| Date | Event | Price |
|---|---|---|
| 10/16/2026 | Listed for sale | $1,050,000$476/sqft |
Source: MLS PIN #73591689 Report a problem | ||
| 10/5/2023 | Listing removed | -- |
Source: Zillow Rentals Report a problem | ||
| 9/8/2023 | Listed for rent | $4,000+5.3%$2/sqft |
Source: Zillow Rentals Report a problem | ||
| 3/17/2022 | Sold | $1,050,000+6.2%$476/sqft |
Source: MLS PIN #72945559 Report a problem | ||
| 8/10/2021 | Listing removed | -- |
Source: Zillow Rental Manager Report a problem | ||
| 8/5/2021 | Price change | $3,800-5%$2/sqft |
Source: Zillow Rental Manager Report a problem | ||
| 7/29/2021 | Price change | $4,000-4.8%$2/sqft |
Source: Zillow Rental Manager Report a problem | ||
| 7/20/2021 | Listed for rent | $4,200-2.3%$2/sqft |
Source: Zillow Rental Manager Report a problem | ||
| 5/24/2021 | Pending sale | $989,000$448/sqft |
Source: MLS PIN #72827006 Report a problem | ||
| 5/18/2021 | Contingent | $989,000$448/sqft |
Source: MLS PIN #72827006 Report a problem | ||
| 5/6/2021 | Listed for sale | $989,000$448/sqft |
Source: MLS PIN #72827006 Report a problem | ||
| 9/17/2019 | Listing removed | $4,300$2/sqft |
Source: Gateway Real Estate Group Report a problem | ||
| 5/7/2019 | Price change | $4,300+14.7%$2/sqft |
Source: Gateway Real Estate Group Report a problem | ||
| 4/19/2019 | Listed for rent | $3,750$2/sqft |
Source: Gateway Real Estate Group Report a problem | ||
| 2/18/2019 | Listing removed | $3,750$2/sqft |
Source: Preview Properties Report a problem | ||
| 1/17/2019 | Listed for rent | $3,750$2/sqft |
Source: Preview Properties Report a problem | ||
| 9/13/2018 | Listing removed | $3,750$2/sqft |
Source: Preview Properties Report a problem | ||
| 5/30/2018 | Listed for rent | $3,750+4.2%$2/sqft |
Source: Zillow Rental Network Report a problem | ||
| 6/7/2016 | Listing removed | $3,600+5.9%$2/sqft |
Source: Griffin Real Estate Report a problem | ||
| 7/18/2013 | Listing removed | $3,400$2/sqft |
Source: Modern Real Estate Report a problem | ||
| 7/11/2013 | Listed for rent | $3,400+6.3%$2/sqft |
Source: Modern Real Estate Report a problem | ||
| 11/2/2012 | Listing removed | $3,200$1/sqft |
Source: Gateway Real Estate Group, Inc. #71436831 Report a problem | ||
| 10/12/2012 | Price change | $3,200+6.7%$1/sqft |
Source: Gateway Real Estate Group, Inc. #71436831 Report a problem | ||
| 10/6/2012 | Price change | $3,000-13%$1/sqft |
Source: Modern Real Estate Report a problem | ||
| 9/15/2012 | Listed for rent | $3,450+15%$2/sqft |
Source: Modern Real Estate Report a problem | ||
| 7/19/2011 | Listing removed | $3,000$1/sqft |
Source: Group Boston Real Estate Report a problem | ||
Public tax history
| Year | Property taxes | Tax assessment |
|---|---|---|
| 2025 | $10,108 +19.6% | $872,900 +12.6% |
| 2024 | $8,452 +1.5% | $775,400 |
| 2023 | $8,328 +14.3% | $775,400 +15.8% |
| 2022 | $7,284 +4% | $669,500 +2% |
| 2021 | $7,004 -10.5% | $656,400 -11.4% |
| 2020 | $7,824 +4.2% | $740,900 +4% |
| 2019 | $7,511 +5.1% | $712,600 +4.5% |
| 2018 | $7,146 +332.1% | $681,900 +8% |
| 2017 | $1,654 -75% | $631,400 +5% |
| 2016 | $6,615 +9.6% | $601,400 +20.6% |
| 2015 | $6,037 +1.5% | $498,500 +10.1% |
| 2013 | $5,950 -4.2% | $452,800 -5% |
| 2012 | $6,212 +2% | $476,400 |
| 2011 | $6,093 +6.6% | $476,400 -1% |
| 2010 | $5,717 +8.6% | $481,200 -2.8% |
| 2009 | $5,263 -4.1% | $495,100 -1% |
| 2008 | $5,486 -1.3% | $500,100 -1.1% |
| 2007 | $5,557 | $505,600 |
Find assessor info on the county website
Monthly payment
Est. payment
Payment breakdown
Explore the cost of this home by adjusting the details. Changes won't be saved.Climate risks
Neighborhood: Brighton


Similar homes
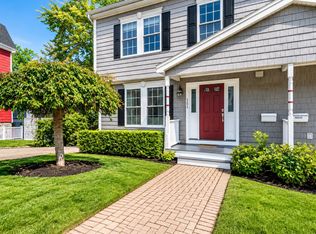
- $1,050,0003 bd3 ba2.6k sqft121 Nonantum St #A, Brighton, MA 02135For Sale
 MLS ID #73588206, Marika & Associates Group, Hammond Residential Real Estate. MLS PIN
- $995,0004 bd2 ba2k sqft44 Mount Vernon St, Boston, MA 02135For Sale
 MLS ID #73594149, Susan and Jen Rothstein Team, Hammond Residential Real Estate. MLS PIN
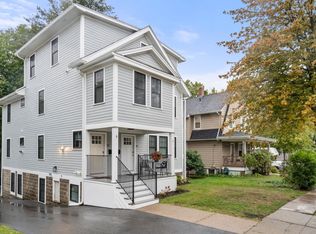
- $1,000,0006 bd3 ba1.8k sqft34 Perthshire Rd #34, Brighton, MA 02135For Sale
 MLS ID #73586177, Lynette Glover, Hammond Residential Real Estate. MLS PIN
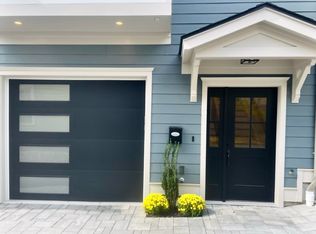
- $1,248,0003 bd4 ba2.1k sqft143-3 Tremont St, Brighton, MA 02135For Sale
 MLS ID #73594254, Anabela Gomes, Urban Realty. MLS PIN
