This 964 square foot single family home has 2 bedrooms and 1.0 bathrooms. This home is located at 12268 Pipe Line Ave, Chino, CA 91710.
Pre-foreclosure
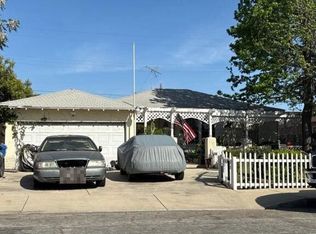
Street View
Est. $631,800
12268 Pipe Line Ave, Chino, CA 91710
2beds
1baths
964sqft
SingleFamily
Built in 1950
8,712 Square Feet Lot
$631,800 Zestimate®
$655/sqft
$-- HOA
Overview
- 281 days |
- 9 |
- 0 |
Facts & features
Interior
Bedrooms & bathrooms
- Bedrooms: 2
- Bathrooms: 1
Heating
- Wall
Cooling
- None
Interior area
- Total interior livable area: 964 sqft
Property
Parking
- Total spaces: 2
- Parking features: Garage - Attached
Lot
- Size: 8,712 Square Feet
Details
- Parcel number: 1016063070000
Construction
Type & style
- Home type: SingleFamily
Materials
- wood frame
- Roof: Built-up
Condition
- Year built: 1950
Community & HOA
Location
- Region: Chino
Financial & listing details
- Price per square foot: $655/sqft
- Tax assessed value: $567,018
- Annual tax amount: $6,325
Visit our professional directory to find a foreclosure specialist in your area that can help with your home search.
Find a foreclosure agentForeclosure details
Estimated market value
$631,800
$600,000 - $670,000
$2,543/mo
Price history
| Date | Event | Price |
|---|---|---|
| 9/26/2022 | Sold | $545,000-5.2%$565/sqft |
Source: Public Record Report a problem | ||
| 9/8/2022 | Pending sale | $575,000$596/sqft |
Source: | ||
| 8/12/2022 | Contingent | $575,000$596/sqft |
Source: | ||
| 7/31/2022 | Listed for sale | $575,000$596/sqft |
Source: | ||
Public tax history
| Year | Property taxes | Tax assessment |
|---|---|---|
| 2025 | $6,325 +2.7% | $567,018 +2% |
| 2024 | $6,157 +2.8% | $555,900 +2% |
| 2023 | $5,986 +997.2% | $545,000 +1081.8% |
| 2022 | $546 +2% | $46,116 +2% |
| 2021 | $535 +1.2% | $45,212 +1% |
| 2020 | $529 +1.7% | $44,748 +2% |
| 2019 | $520 +2.1% | $43,871 +2% |
| 2018 | $509 +1.8% | $43,011 +2% |
| 2017 | $500 | $42,167 +2% |
| 2016 | $500 +6.6% | $41,340 +1.5% |
| 2015 | $469 +1.9% | $40,719 +2% |
| 2014 | $461 | $39,922 +0.5% |
| 2013 | -- | $39,742 +2% |
| 2012 | -- | $38,963 +2% |
| 2011 | -- | $38,199 +0.8% |
| 2010 | -- | $37,914 -0.2% |
| 2009 | -- | $38,005 +2% |
| 2008 | -- | $37,260 +2% |
| 2007 | -- | $36,529 +2% |
| 2006 | -- | $35,813 +2% |
| 2005 | -- | $35,110 +2% |
| 2004 | -- | $34,422 +1.9% |
| 2003 | -- | $33,791 +2% |
| 2002 | -- | $33,128 +2% |
| 2001 | -- | $32,479 +2% |
| 2000 | -- | $31,842 |
Find assessor info on the county website
Monthly payment
Estimated monthly payment$1,822
All calculations are estimates and provided by Zillow, Inc. for informational purposes only. Actual amounts may vary.
HOA fees may include property taxes on listings classified as Co-Ops. Contact the listing agent and/or owner for fee details.
Mortgage interest rates are dependent on a number of factors, including credit score, down payment, and repayment length. Interest rate data provided by Zillow Group Marketplace, Inc. as of 1/1/1970 from various mortgage lenders with which we have lead or other similar arrangements; the Estimated Payment is an average of those rates.
See how much you could borrow to make a competitive offer.
Climate risks
Neighborhood: 91710
Nearby schools
GreatSchools rating
- 4/10Newman Elementary SchoolGrades: K-6Distance: 0.3 mi
- 6/10Lyle S. Briggs Fundamental SchoolGrades: K-8Distance: 0.6 mi
- 5/10Don Antonio Lugo High SchoolGrades: 9-12Distance: 1.4 mi


- California
- San Bernardino County
- Chino
- 91710
- 12268 Pipe Line Ave
Nearby cities
Nearby zip codes
Other Chino Topics
