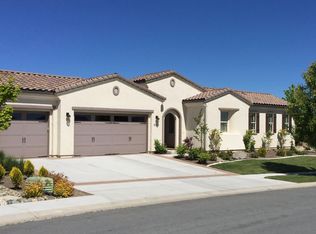
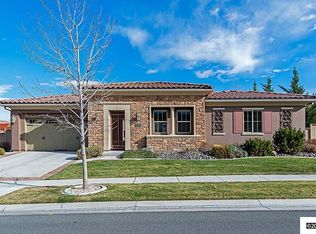
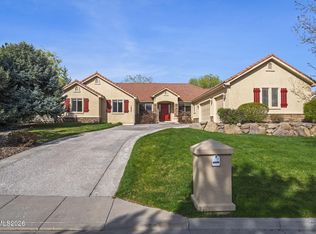
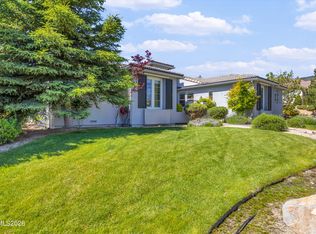
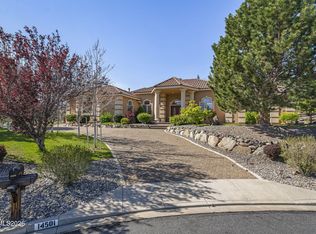
This 3496 square foot single family home has 3 bedrooms and 3.5 bathrooms. This home is located at 13375 Rock Crossing Dr, Reno, NV 89511.
Pre-foreclosure
Est. $1,428,400
13375 Rock Crossing Dr, Reno, NV 89511
3beds
3baths
3,496sqft
SingleFamily
Built in 2012
0.35 Acres Lot
$1,428,400 Zestimate®
$409/sqft
$81/mo HOA
Overview
- 67 days |
- 30 |
- 0 |
Facts & features
Interior
Bedrooms & bathrooms
- Bedrooms: 3
- Bathrooms: 3.5
Heating
- Forced air
Cooling
- Central
Features
- Has fireplace: Yes
Interior area
- Total interior livable area: 3,496 sqft
Property
Parking
- Parking features: Garage - Attached
Features
- Exterior features: Stucco
Lot
- Size: 0.35 Acres
Details
- Parcel number: 14237103
Construction
Type & style
- Home type: SingleFamily
Materials
- Frame
- Roof: Tile
Condition
- Year built: 2012
Community & HOA
HOA
- Has HOA: Yes
- HOA fee: $81 monthly
Location
- Region: Reno
Financial & listing details
- Price per square foot: $409/sqft
- Tax assessed value: $975,996
- Annual tax amount: $9,753
Visit our professional directory to find a foreclosure specialist in your area that can help with your home search.
Find a foreclosure agentForeclosure details
Estimated market value
$1,428,400
$1.33M - $1.56M
$4,102/mo
Price history
| Date | Event | Price |
|---|---|---|
| 6/29/2012 | Sold | $509,000$146/sqft |
Source: Public Record Report a problem | ||
Public tax history
| Year | Property taxes | Tax assessment |
|---|---|---|
| 2026 | $9,753 +3% | $341,599 -2.5% |
| 2025 | $9,470 +3% | $350,458 +1.6% |
| 2024 | $9,196 +2.9% | $344,772 +3.2% |
| 2023 | $8,938 +8.1% | $334,030 +20% |
| 2022 | $8,266 +6.3% | $278,282 +8.5% |
| 2021 | $7,776 +5% | $256,595 +6.8% |
| 2020 | $7,404 -4.8% | $240,294 |
| 2019 | $7,776 +5% | $240,294 +7.3% |
| 2018 | $7,404 +12.1% | $223,843 +6.1% |
| 2017 | $6,606 | $211,072 +3.3% |
| 2016 | $6,606 | $204,379 +7.1% |
| 2015 | $6,606 +3.4% | $190,769 +3.9% |
| 2014 | $6,390 | $183,696 +8.6% |
| 2013 | $6,390 | $169,173 |
| 2012 | -- | $169,173 +644% |
| 2011 | -- | $22,738 -18.1% |
| 2010 | -- | $27,751 -35.9% |
| 2009 | -- | $43,314 -13.8% |
| 2008 | -- | $50,225 -16.1% |
| 2007 | -- | $59,850 |
Find assessor info on the county website
Monthly payment
Estimated monthly payment$1,822
All calculations are estimates and provided by Zillow, Inc. for informational purposes only. Actual amounts may vary.
HOA fees may include property taxes on listings classified as Co-Ops. Contact the listing agent and/or owner for fee details.
Mortgage interest rates are dependent on a number of factors, including credit score, down payment, and repayment length. Interest rate data provided by Zillow Group Marketplace, Inc. as of 1/1/1970 from various mortgage lenders with which we have lead or other similar arrangements; the Estimated Payment is an average of those rates.
See how much you could borrow to make a competitive offer.
Climate risks
Neighborhood: South Reno
Getting around
11 / 100
Minimal TransitNearby schools
GreatSchools rating
- 8/10Elizabeth Lenz Elementary SchoolGrades: PK-5Distance: 1.4 mi
- 7/10Marce Herz Middle SchoolGrades: 6-8Distance: 1.6 mi
- 7/10Galena High SchoolGrades: 9-12Distance: 1.6 mi


- Nevada
- Washoe County
- Reno
- 89511
- South Reno
- 13375 Rock Crossing Dr
Nearby cities
Nearby neighborhoods
Nearby zip codes
Other Reno Topics
