This 1280 square foot multi family home has 3 bedrooms and 2.0 bathrooms. This home is located at 13929 Magnolia St, Garden Grove, CA 92844.
Pre-foreclosure
Est. $934,300
13929 Magnolia St, Garden Grove, CA 92844
3beds
2baths
1,280sqft
MultiFamily
Built in 1972
-- sqft lot
$934,300 Zestimate®
$730/sqft
$312/mo HOA
Overview
- 62 days
- 22
- 0
Facts & features
Interior
Bedrooms & bathrooms
- Bedrooms: 3
- Bathrooms: 2
Heating
- Other
Appliances
- Included: Dishwasher, Garbage disposal, Range / Oven
Features
- Flooring: Carpet
Interior area
- Total interior livable area: 1,280 sqft
Property
Parking
- Parking features: Garage - Attached, Off-street
Lot
- Size: 925 Acres
Details
- Parcel number: 09729415
Construction
Type & style
- Home type: MultiFamily
Condition
- Year built: 1972
Community & HOA
HOA
- Has HOA: Yes
- HOA fee: $312 monthly
Location
- Region: Garden Grove
Financial & listing details
- Price per square foot: $730/sqft
- Tax assessed value: $182,302
Foreclosure details
Estimated market value
$934,300
$860,000 - $1.02M
$3,306/mo
Price history
| Date | Event | Price |
|---|---|---|
| 8/18/2025 | Listing removed | $650,000$508/sqft |
Source:  SDMLS #PW25026372 Report a problem | ||
| 6/28/2025 | Listed for sale | $650,000$508/sqft |
Source: SDMLS #PW25026372 Report a problem | ||
| 5/10/2019 | Listing removed | $2,400$2/sqft |
Source: www.turbotenant.com Report a problem | ||
| 3/30/2019 | Listed for rent | $2,400+4.3%$2/sqft |
Source: www.turbotenant.com Report a problem | ||
| 4/26/2018 | Listing removed | $2,300$2/sqft |
Source: Owner Report a problem | ||
| 4/24/2018 | Listed for rent | $2,300+4.5%$2/sqft |
Source: Owner Report a problem | ||
| 8/4/2017 | Listing removed | $2,200$2/sqft |
Source: www.turbotenant.com Report a problem | ||
| 7/26/2017 | Listed for rent | $2,200$2/sqft |
Source: Zillow Rental Network Report a problem | ||
Public tax history
| Year | Property taxes | Tax assessment |
|---|---|---|
| 2026 | -- | $182,302 +2% |
| 2025 | $2,548 +1.5% | $178,728 +2% |
| 2024 | $2,510 +3.3% | $175,224 +2% |
| 2023 | $2,429 +1.7% | $171,789 +2% |
| 2022 | $2,389 +2.1% | $168,421 +2% |
| 2021 | $2,341 | $165,119 +1% |
| 2020 | -- | $163,426 +2% |
| 2019 | $2,313 +1.1% | $160,222 +2% |
| 2018 | $2,289 +3.8% | $157,081 +2% |
| 2017 | $2,204 | $154,001 +2% |
| 2016 | $2,204 +3.7% | $150,982 +1.5% |
| 2015 | $2,125 +4.1% | $148,715 +2% |
| 2014 | $2,042 | $145,802 +0.5% |
| 2013 | -- | $145,144 +2% |
| 2012 | -- | $142,299 +2% |
| 2011 | -- | $139,509 +0.8% |
| 2010 | -- | $138,467 -0.2% |
| 2009 | -- | $138,797 +2% |
| 2008 | -- | $136,076 +2% |
| 2007 | -- | $133,408 +2% |
| 2006 | -- | $130,793 +2% |
| 2005 | -- | $128,229 +2% |
| 2004 | -- | $125,715 +1.9% |
| 2003 | -- | $123,411 +2% |
| 2002 | -- | $120,992 +2% |
| 2001 | $1,348 +1.9% | $118,620 +2% |
| 2000 | $1,324 | $116,295 |
Find assessor info on the county website
Monthly payment
Climate risks
Neighborhood: 92844


Similar homes
- $960,0003 bd2 ba1.2k sqft8565 Sierra Cir Unit 916A, Huntington Beach, CA 92646For Sale
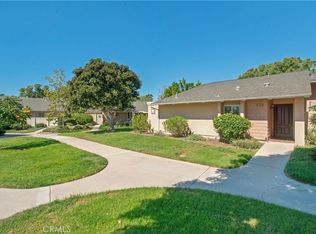 MLS ID #OC26216726, Diana Perna, PK Real Estate & Investments. CRMLS
- $665,0002 bd3 ba1k sqft8431 Larson Ave APT 9, Garden Grove, CA 92844For Sale
 MLS ID #PW26158574, Kenneth Le, Alliance West Realty. CRMLS
- $650,0002 bd3 ba1.3k sqft12585 Cluster Pines Rd, Garden Grove, CA 92845For Sale
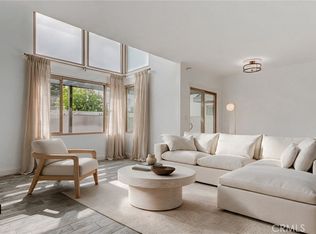 MLS ID #PI26197333, Katie Bautista, Compass. CRMLS
- $549,9002 bd2 ba1k sqft10416 W Briar Oaks Dr APT D, Stanton, CA 90680For Sale
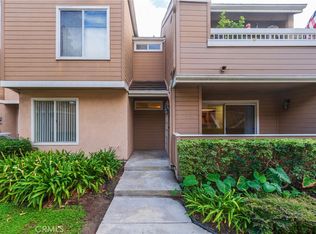 MLS ID #PW26235890, Meghan Shigo, Century 21 Affiliated. CRMLS
