Charm and curb appeal abound for this Plant City home! Step inside into the well-appointed living room, which leads to the home's family room. The kitchen features stainless steel appliances, hard surface countertops and ample storage. Rounding out this ranch style floorplan is the home's primary suite and two secondary bedrooms. Schedule your showing today and see for yourself the possibilities!
For sale
$250,000
1501 NEIL STREET, PLANT CITY, FL 33563
3beds
1,320sqft
Single Family Residence
Built in 1959
5,300 Square Feet Lot
$245,200 Zestimate®
$189/sqft
$-- HOA
What's special
Charm and curb appealTwo secondary bedroomsFamily roomAmple storageHard surface countertopsPrimary suite
- 9 days
- 761
- 95
Likely to sell faster than
Zillow last checked:
Listing updated:
Listed by:
Blake Keathley 661-900-9145,
EVERYSTATE INC. 501-725-1234
Source: Stellar MLS,MLS#: O6457171 Originating MLS: Orlando Regional
Facts & features
Interior
Bedrooms & bathrooms
- Bedrooms: 3
- Bathrooms: 2
- Full bathrooms: 1
- 1/2 bathrooms: 1
Primary bedroom
- Features: Built-in Closet
- Level: First
- Area: 187 Square Feet
- Dimensions: 11x17
Bedroom 2
- Features: Built-in Closet
- Level: First
- Area: 176 Square Feet
- Dimensions: 16x11
Bedroom 3
- Features: Built-in Closet
- Level: First
- Area: 132 Square Feet
- Dimensions: 12x11
Foyer
- Level: First
- Area: 24 Square Feet
- Dimensions: 3x8
Kitchen
- Level: First
- Area: 64 Square Feet
- Dimensions: 8x8
Living room
- Level: First
- Area: 360 Square Feet
- Dimensions: 18x20
Heating
- Other
Cooling
- Other
Appliances
- Included: Microwave, Range, Refrigerator
- Laundry: Inside
Features
- Other
- Flooring: Tile
- Has fireplace: No
Interior area
- Total structure area: 1,604
- Total interior livable area: 1,320 sqft
Video & virtual tour
Property
Parking
- Total spaces: 1
- Parking features: Garage
- Garage spaces: 1
Features
- Levels: One
- Stories: 1
- Exterior features: Other
Lot
- Size: 5,300 Square Feet
- Dimensions: 53 x 100
Details
- Parcel number: P2828225BD00000000005.0
- Zoning: R-1
- Special conditions: None
Construction
Type & style
- Home type: SingleFamily
- Property subtype: Single Family Residence
Materials
- Other
- Foundation: Other
- Roof: Other
Condition
- New construction: No
- Year built: 1959
Utilities & green energy
- Sewer: Public Sewer
- Water: Public
- Utilities for property: Electricity Available, Water Available
Community & HOA
Community
- Pet fee: $0 monthly
- Subdivision: ROSEMONT SUB
HOA
- Has HOA: No
Location
- Region: Plant City
Financial & listing details
- Price per square foot: $189/sqft
- Tax assessed value: $194,921
- Annual tax amount: $3,565
- Date on market: 11/13/2026
- Cumulative days on market: 9 days
- Listing terms: Cash,Conventional,FHA,VA Loan
- Ownership: Fee Simple
- Total actual rent: 0
- Electric utility on property: Yes
- Road surface type: Other
Estimated market value
$245,200
$233,000 - $257,000
$1,938/mo
Price history
| Date | Event | Price |
|---|---|---|
| 11/13/2026 | Listed for sale | $250,000-7.4%$189/sqft |
Source:  Stellar MLS #O6457171 Report a problem | ||
| 5/26/2025 | Listing removed | $1,813$1/sqft |
Source: Zillow Rentals Report a problem | ||
| 5/7/2025 | Price change | $1,813-0.5%$1/sqft |
Source: Zillow Rentals Report a problem | ||
| 5/2/2025 | Price change | $1,823-0.8%$1/sqft |
Source: Zillow Rentals Report a problem | ||
| 4/17/2025 | Price change | $1,838-5%$1/sqft |
Source: Zillow Rentals Report a problem | ||
| 3/24/2025 | Listed for rent | $1,935+0.5%$1/sqft |
Source: Zillow Rentals Report a problem | ||
| 3/11/2025 | Listing removed | $270,000$205/sqft |
Source: Stellar MLS #O6284732 Report a problem | ||
| 3/4/2025 | Listed for sale | $270,000+1.9%$205/sqft |
Source: Stellar MLS #O6284732 Report a problem | ||
| 1/24/2025 | Listing removed | $1,925$1/sqft |
Source: Zillow Rentals Report a problem | ||
| 12/10/2024 | Listed for rent | $1,925+1.6%$1/sqft |
Source: Zillow Rentals Report a problem | ||
| 9/30/2024 | Listing removed | $265,000+4.8%$201/sqft |
Source: Stellar MLS #T3322801 Report a problem | ||
| 9/30/2023 | Listing removed | -- |
Source: Stellar MLS #T3322801 Report a problem | ||
| 6/13/2023 | Listing removed | -- |
Source: Zillow Rentals Report a problem | ||
| 3/24/2023 | Price change | $1,895-1.3%$1/sqft |
Source: Zillow Rentals Report a problem | ||
| 2/27/2023 | Listed for rent | $1,920+13.3%$1/sqft |
Source: Zillow Rentals Report a problem | ||
| 1/31/2022 | Listing removed | -- |
Source: Zillow Rental Network Premium Report a problem | ||
| 1/16/2022 | Price change | $1,695-1.7%$1/sqft |
Source: Zillow Rental Network Premium Report a problem | ||
| 1/5/2022 | Price change | $1,725-2.8%$1/sqft |
Source: Zillow Rental Network Premium Report a problem | ||
| 12/27/2021 | Price change | $1,775-5.3%$1/sqft |
Source: Zillow Rental Network Premium Report a problem | ||
| 12/16/2021 | Price change | $1,875-2.3%$1/sqft |
Source: Zillow Rental Network Premium Report a problem | ||
| 11/29/2021 | Listed for rent | $1,920$1/sqft |
Source: Zillow Rental Network Premium Report a problem | ||
| 10/5/2021 | Sold | $252,800-4.6%$192/sqft |
Source: Public Record Report a problem | ||
| 9/13/2021 | Pending sale | $265,000$201/sqft |
Source: Stellar MLS #T3322801 Report a problem | ||
| 9/3/2021 | Listed for sale | $265,000$201/sqft |
Source: Stellar MLS #T3322801 Report a problem | ||
| 8/28/2021 | Pending sale | $265,000$201/sqft |
Source: Stellar MLS #T3322801 Report a problem | ||
| 8/7/2021 | Listed for sale | $265,000+188%$201/sqft |
Source: Stellar MLS #T3322801 Report a problem | ||
| 3/21/2019 | Sold | $92,000$70/sqft |
Source: Public Record Report a problem | ||
Public tax history
| Year | Property taxes | Tax assessment |
|---|---|---|
| 2025 | $3,566 +6.1% | $194,921 +1.5% |
| 2024 | $3,361 +6.7% | $192,112 +7.6% |
| 2023 | $3,151 +3.7% | $178,543 +4.4% |
| 2022 | $3,037 +98.4% | $170,999 +113.6% |
| 2021 | $1,531 +15% | $80,071 +10% |
| 2020 | $1,332 +35.8% | $72,792 +49% |
| 2019 | $981 | $48,861 -11.8% |
| 2018 | $981 +27.8% | $55,385 +37.2% |
| 2017 | $767 | $40,381 +1.7% |
| 2016 | $767 0% | $39,700 +2.4% |
| 2015 | $768 | $38,755 -3.8% |
| 2014 | $768 +8.9% | $40,289 +10% |
| 2013 | $705 +4.9% | $36,626 +6.1% |
| 2012 | $672 -9% | $34,505 -8.8% |
| 2011 | $738 -17.3% | $37,843 -17.7% |
| 2010 | $892 -31.6% | $45,985 -31.2% |
| 2009 | $1,305 -20.6% | $66,835 -22.5% |
| 2008 | $1,645 +2921.5% | $86,198 +203.5% |
| 2007 | $54 +20.3% | $28,397 +2.5% |
| 2006 | $45 +53.4% | $27,704 +3% |
| 2005 | $30 | $26,897 +3% |
| 2004 | -- | $26,114 +1.9% |
| 2003 | -- | $25,627 +2.4% |
| 2002 | -- | $25,026 +1.6% |
| 2001 | -- | $24,632 -29.1% |
| 2000 | -- | $34,725 |
Find assessor info on the county website
Monthly payment
Est. payment
Payment breakdown
Explore the cost of this home by adjusting the details. Changes won't be saved.Climate risks
Neighborhood: 33563
Similar homes
- $229,0002 bd1 ba850 sqft1205 E LAURA STREET, PLANT CITY, FL 33563For Sale

 MLS ID #TB8565294, Nelson Mateus, DALTON WADE INC. Stellar MLS
- $285,0003 bd1 ba1k sqft3001 S WILLOW DRIVE, PLANT CITY, FL 33566For Sale
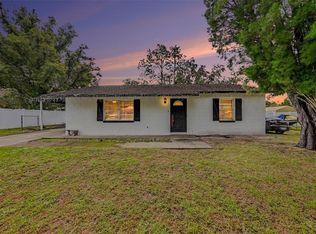 MLS ID #TB8569002, Yousef Bassoumi, LPT REALTY, LLC. Stellar MLS
- $275,0003 bd2 ba1.4k sqft4133 BARRET AVENUE, PLANT CITY, FL 33566For Sale
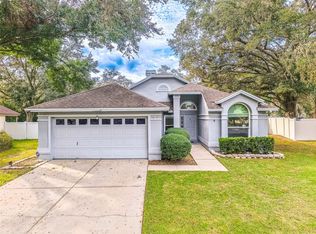 MLS ID #L4966476, David Small, KELLER WILLIAMS REALTY SMART 1. Stellar MLS
- $200,0002 bd2 ba1.1k sqft2004 CEDAR RUN DR, PLANT CITY, FL 33563For Sale
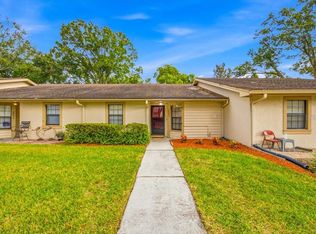 MLS ID #TB8563943, Mike Griffin, REALTY ADVISOR EXPERTS. Stellar MLS
- $247,9003 bd2 ba1.1k sqft3014 VENICE WAY, LAKELAND, FL 33803For SaleMLS ID #L4963112, Chris Renfro, KELLER WILLIAMS REALTY SMART. Stellar MLS
- $284,9003 bd2 ba1.4k sqft521 W PALMEDEN DRIVE, LAKELAND, FL 33803For SaleMLS ID #O6398869, Robert Salmons, ENTERA REALTY LLC. Stellar MLS
- $252,0003 bd2 ba1.5k sqft303 GRANADA ROAD, AUBURNDALE, FL 33823For SaleMLS ID #O6442954, Carolina Arevalo Jimenez, AXEN REALTY LLC. Stellar MLS
- $283,4993 bd2 ba975 sqft4419 DOLPHIN DR, TAMPA, FL 33617For SaleMLS ID #TB8528509, Justin Meyers, ORCHARD BROKERAGE, LLC. Stellar MLS
- $259,9993 bd1 ba1.3k sqft39250 MIRAMAR DRIVE, ZEPHYRHILLS, FL 33540For SaleMLS ID #TB8544669, Natosha Jones, CENTURY 21 BILL NYE REALTY. Stellar MLS
- $224,9004 bd3 ba1.8k sqft1231 ROBERT KING HIGH DRIVE, LAKELAND, FL 33805For SaleMLS ID #N6146409, Jon Maio, EXP REALTY LLC. Stellar MLS
- $269,9003 bd2 ba1.2k sqft7021 SHEFFIELD DRIVE, LAKELAND, FL 33810For SaleMLS ID #TB8546766, Crystal Sanchez, RHODES REALTY GROUP, LLC. Stellar MLS
- $275,0003 bd2 ba1.6k sqft1851 E ELM ROAD, LAKELAND, FL 33801For SaleMLS ID #O6412362, Diane Guerrero, JUPITER PROPERTIES, INC. Stellar MLS
- $215,0003 bd2 ba1.1k sqft2531 HEBB ROAD, AUBURNDALE, FL 33823For SaleMLS ID #S5159272, Brenda Brooks, KELLER WILLIAMS REALTY SMART 1. Stellar MLS
- $250,9004 bd1 ba1.2k sqft3209 N 45TH STREET, TAMPA, FL 33605For SaleMLS ID #O6431621, Summer Brady, MAINSTAY BROKERAGE LLC. Stellar MLS
- $255,0002 bd2 ba1.4k sqft5848 CYPRESS STREET, ZEPHYRHILLS, FL 33542For SaleMLS ID #TB8560514, Summer Baker, PA, RE/MAX CHAMPIONS. Stellar MLS
- $267,0003 bd1 ba985 sqft5225 PEACH AVENUE, SEFFNER, FL 33584For SaleMLS ID #TB8532756, Christopher Nelson, MILLENNIAL REALTY & PROPERTY MGMT.. Stellar MLS
- $259,0002 bd2 ba1.1k sqft5067 BLACK BIRCH TRAIL, MULBERRY, FL 33860For SaleMLS ID #TB8487527, Tommaso Bellifemine, FLORIDA EXECUTIVE REALTY 2. Stellar MLS
- $285,0003 bd3 ba1.4k sqft1658 PALM LEAF DRIVE, BRANDON, FL 33510For SaleMLS ID #TB8563335, Chris Sakamoto, MARK SPAIN REAL ESTATE. Stellar MLS
- $339,9003 bd2 ba1.5k sqft3514 WINTERBERRY LANE, VALRICO, FL 33594For SaleMLS ID #TB8568368, Carissa Wallace, LPT REALTY, LLC. Stellar MLS
- $250,0003 bd2 ba1.4k sqft2222 CASPIAN DRIVE, LAKELAND, FL 33805For SaleMLS ID #O6419226, Josue Soto, EXP REALTY LLC. Stellar MLS
