Developer's dream: multi family, multi-unit triplex, huge lot in a neighborhood with rapidly and consistently appreciating property values. Unlock the potential of this unique east Weymouth triplex. Whether you're looking to expand your multi family portfolio, execute a high value-add renovation or secure a long-term asset in a high demand rental market, this property offers the scale, location and upside investors seek. High rental demand property, being a 10 minute walk to the red line, 4 Minute walk to the bus routes with bustling nearby shopping and quality local restaurants.20-24 Lake Street represents an opportunity to create immediate and long-term value in one of the South Shore's most established neighborhoods.
For sale
$790,000
20 Lake St, Weymouth, MA 02189
6beds
2,856sqft
3 Family - 3 Units Side by Side
Built in 1848
-- sqft lot
$795,400 Zestimate®
$277/sqft
$-- HOA
What's special
Huge lot
- 22 days
- 643
- 38
Zillow last checked:
Listing updated:
Listed by:
Douglas T. Babcock 617-571-5465,
Law Offices of Douglas T. Babcock 617-571-5465,
Douglas T. Babcock 617-571-5465
Source: MLS PIN,MLS#: 73584829
Facts & features
Interior
Bedrooms & bathrooms
- Bedrooms: 6
- Bathrooms: 4
- Full bathrooms: 3
- 1/2 bathrooms: 1
Features
- Has basement: No
- Has fireplace: No
Interior area
- Total structure area: 2,856
- Total interior livable area: 2,856 sqft
- Finished area above ground: 2,856
Property
Parking
- Total spaces: 8
- Parking features: Garage
- Garage spaces: 2
- Uncovered spaces: 6
Lot
- Size: 6,950 Square Feet
- Features: Corner Lot
Details
- Parcel number: 275931
- Zoning: R-1
Construction
Type & style
- Home type: MultiFamily
- Property subtype: 3 Family - 3 Units Side by Side
Materials
- Foundation: Irregular
Condition
- Year built: 1848
Utilities & green energy
- Sewer: Public Sewer
- Water: Public
Community & HOA
Location
- Region: Weymouth
Financial & listing details
- Price per square foot: $277/sqft
- Tax assessed value: $677,000
- Annual tax amount: $6,838
- Date on market: 9/30/2026
- Total actual rent: 6000
Estimated market value
$795,400
$756,000 - $835,000
$3,532/mo
Price history
| Date | Event | Price |
|---|---|---|
| 9/30/2026 | Listed for sale | $790,000-11.2%$277/sqft |
Source: MLS PIN #73584829 Report a problem | ||
| 9/1/2026 | Listing removed | $890,000$312/sqft |
Source: MLS PIN #73535940 Report a problem | ||
| 6/15/2026 | Listed for sale | $890,000+304.5%$312/sqft |
Source: MLS PIN #73535940 Report a problem | ||
| 8/19/2019 | Sold | $220,000+33.3%$77/sqft |
Source: Agent Provided Report a problem | ||
| 8/26/1996 | Sold | $165,000+47.3%$58/sqft |
Source: Public Record Report a problem | ||
| 12/17/1992 | Sold | $112,000$39/sqft |
Source: Public Record Report a problem | ||
Public tax history
| Year | Property taxes | Tax assessment |
|---|---|---|
| 2025 | $6,838 +3.2% | $677,000 +4.9% |
| 2024 | $6,627 +2.9% | $645,300 +4.7% |
| 2023 | $6,438 +3.3% | $616,100 +13.3% |
| 2022 | $6,232 -0.2% | $543,800 +2.3% |
| 2021 | $6,243 +4.9% | $531,800 +6.5% |
| 2020 | $5,954 +4.2% | $499,500 +6% |
| 2019 | $5,713 +6.4% | $471,400 +9.8% |
| 2018 | $5,369 +5.4% | $429,500 +8% |
| 2017 | $5,093 +7.9% | $397,600 +7.9% |
| 2016 | $4,718 +4.2% | $368,600 +5% |
| 2015 | $4,528 +2.1% | $351,000 +5.2% |
| 2014 | $4,436 +2.9% | $333,500 0% |
| 2013 | $4,313 +7.6% | $333,600 +1.1% |
| 2012 | $4,007 +3.2% | $330,100 -0.6% |
| 2011 | $3,881 +5.7% | $332,000 -11.4% |
| 2010 | $3,670 | $374,900 |
| 2009 | $3,670 +2.6% | $374,900 -2.6% |
| 2008 | $3,576 +8.9% | $384,900 +6.3% |
| 2007 | $3,284 +1.5% | $362,100 |
| 2006 | $3,234 +8.7% | $362,100 +7.8% |
| 2005 | $2,974 +2.2% | $336,000 +46.6% |
| 2004 | $2,909 +2.9% | $229,200 |
| 2003 | $2,826 +2.2% | $229,200 |
| 2002 | $2,764 +9.8% | $229,200 +38.9% |
| 1999 | $2,518 | $165,000 |
Find assessor info on the county website
Monthly payment
Est. payment
Payment breakdown
Explore the cost of this home by adjusting the details. Changes won't be saved.Climate risks
Neighborhood: East Weymouth

Similar homes
- $799,0005 bd2 ba2.1k sqft997 Pleasant St, Weymouth, MA 02189For Sale
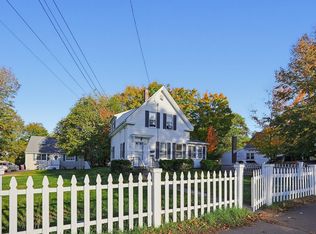 MLS ID #73593992, Carmela Papandrea, Fast Plus Realty, Inc.. MLS PIN
- $--3 bd3 ba1.8k sqft267 Middle St, Weymouth, MA 02189Auction
 Auction.com 2
- $829,9004 bd2 ba2.2k sqft50 Friend St, Weymouth, MA 02189For Sale
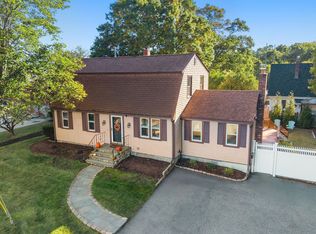 MLS ID #73593534, Hans Brings RESULTS, Coldwell Banker Realty - Waltham. MLS PIN
- $799,0003 bd2 ba2.4k sqft140 Mount Vernon Rd E, Weymouth, MA 02189For Sale
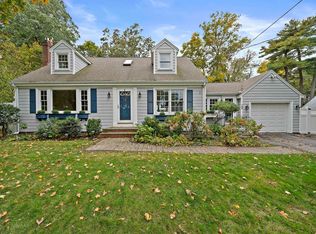 MLS ID #73591345, Jessica Molisse, William Raveis R.E. & Home Services. MLS PIN
