**SHORT SALE**SOLD AS-IS**PRICE NOT YET APPROVED BY LENDER**PROFESSIONALLY NEGOTIATED BY THIRD PARTY** Three bedroom colonial located on almost a quarter acre of land! Excellent commuter location with access to several major routes and highways. Close to tons of shopping, restaurants and entertainment! Subject to short sale negotiation fee of $5,000 paid at closing by buyer. Smoke certificate and final water bill is buyer's responsibility **ALL OFFERS MUST HAVE SIGNED DISCLOSURE ATTACHED TO THIS LISTING**
Pending
$350,000
20 Sandy Ln, Lowell, MA 01854
3beds
1,951sqft
Single Family Residence
Built in 1987
10,010 Square Feet Lot
$635,800 Zestimate®
$179/sqft
$-- HOA
What's special
- 63 days
- 18
- 3
Zillow last checked:
Listing updated:
Listed by:
Vision Realty Group 617-800-9111,
LAER Realty Partners 978-369-1670
Source: MLS PIN,MLS#: 72463231
Facts & features
Interior
Bedrooms & bathrooms
- Bedrooms: 3
- Bathrooms: 2
- Full bathrooms: 1
- 1/2 bathrooms: 1
Heating
- Baseboard, Natural Gas
Cooling
- None
Features
- Has basement: No
- Has fireplace: No
Interior area
- Total structure area: 1,951
- Total interior livable area: 1,951 sqft
Property
Parking
- Total spaces: 5
- Parking features: Paved Drive
- Garage spaces: 1
- Uncovered spaces: 4
Lot
- Size: 10,010 Square Feet
Details
- Parcel number: M:21 B:5203 L:20,3174475
- Zoning: S1003
- Special conditions: Short Sale
Construction
Type & style
- Home type: SingleFamily
- Architectural style: Colonial
- Property subtype: Single Family Residence
Materials
- Foundation: Concrete Perimeter
Condition
- Year built: 1987
Utilities & green energy
- Sewer: Public Sewer
- Water: Public
Community & HOA
HOA
- Has HOA: No
Location
- Region: Lowell
Financial & listing details
- Price per square foot: $179/sqft
- Tax assessed value: $341,800
- Annual tax amount: $4,799
- Date on market: 9/5/2026
Estimated market value
$635,800
$604,000 - $668,000
$3,357/mo
Price history
| Date | Event | Price |
|---|---|---|
| 9/23/2026 | Pending sale | $350,000$179/sqft |
Source: MLS PIN #72463231 Report a problem | ||
| 4/4/2019 | Listing removed | $350,000$179/sqft |
Source: LAER Realty Partners #72463231 Report a problem | ||
| 3/21/2019 | Pending sale | $350,000$179/sqft |
Source: LAER Realty Partners #72463231 Report a problem | ||
| 3/21/2019 | Price change | $350,000-7.9%$179/sqft |
Source: LAER Realty Partners #72463231 Report a problem | ||
| 2/15/2019 | Listed for sale | -- |
Source: Hudson & Marshall Report a problem | ||
| 4/12/2017 | Sold | $380,000-2.5%$195/sqft |
Source: Public Record Report a problem | ||
| 2/28/2017 | Pending sale | $389,900$200/sqft |
Source: RE/MAX PARTNERS #72108652 Report a problem | ||
| 2/2/2017 | Price change | $389,900-2.5%$200/sqft |
Source: RE/MAX Partners #72108652 Report a problem | ||
| 1/14/2017 | Listed for sale | $399,900+113.5%$205/sqft |
Source: RE/MAX Partners #72108652 Report a problem | ||
| 12/23/1987 | Sold | $187,300$96/sqft |
Source: Public Record Report a problem | ||
Public tax history
| Year | Property taxes | Tax assessment |
|---|---|---|
| 2025 | $6,335 -1.3% | $551,800 +2.4% |
| 2024 | $6,416 +4.2% | $538,700 +8.7% |
| 2023 | $6,157 +22.6% | $495,700 +32.9% |
| 2022 | $5,021 | $373,000 |
| 2021 | $5,021 +3.9% | $373,000 +3.1% |
| 2020 | $4,834 +0.7% | $361,800 +5.9% |
| 2019 | $4,799 -1.9% | $341,800 +0.5% |
| 2018 | $4,894 +3.1% | $340,100 +6.8% |
| 2017 | $4,749 +2.8% | $318,300 +4.4% |
| 2016 | $4,621 | $304,800 |
Find assessor info on the county website
Monthly payment
Est. payment
Payment breakdown
Explore the cost of this home by adjusting the details. Changes won't be saved.Climate risks
Neighborhood: Pawtucketville

Similar homes
- $370,0002 bd2 ba1.1k sqft1271 Pawtucket Blvd APT 11, Lowell, MA 01854For Sale
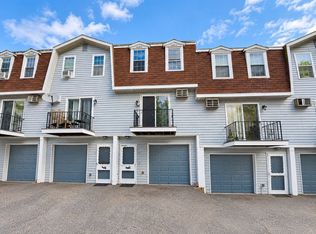 MLS ID #73594381, Uma Vadher, eRealty Advisors, Inc.. MLS PIN
- $350,0003 bd2 ba1.6k sqftCanal Place, Lowell, MA 01852For Sale
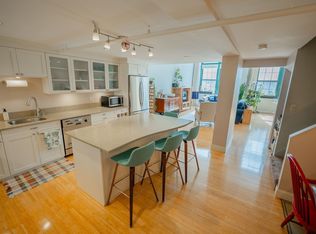 MLS ID #73576046, Peter E. Smith, Peter Smith Realty. MLS PIN
- $374,9002 bd2 ba1.2k sqftWilliamsburg I, North Chelmsford, MA 01863For Sale
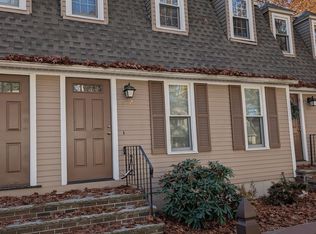 MLS ID #73598783, Dawn Sylvester, RE/MAX Triumph Realty. MLS PIN
- $429,8003 bd1 ba1k sqft35 Sparks St, Lowell, MA 01854For Sale
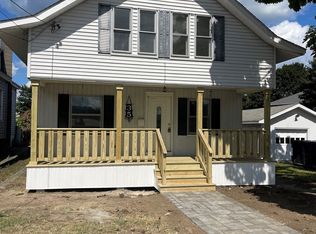 MLS ID #73564434, Stephen Lawrenson, Stephen Lawrenson Real Estate. MLS PIN
