California bungalow nestled in the Irving neighborhood
For sale by owner
$293,000
2009 Sewell St, Lincoln, NE 68502
2beds
1,429sqft
SingleFamily
Built in 1921
6,970 Square Feet Lot
$-- Zestimate®
$205/sqft
$-- HOA
Overview
What the owner loves about this home
It's cozy, warm and relaxing. It just feels like home the minute you walk through the door. The back yard feels like an oasis and great for entertaining friends and family. All appliances stay including washer/dryer. The 2 stall garage has a brand new door and opener.
- 12 days
- 475
- 32
Listed by:
Property Owner (402) 405-2446
Facts & features
Interior
Bedrooms & bathrooms
- Bedrooms: 2
- Bathrooms: 2
- Full bathrooms: 2
Heating
- Forced air
Features
- Basement: Partially finished
- Has fireplace: Yes
Interior area
- Total interior livable area: 1,429 sqft
Property
Parking
- Total spaces: 2
- Parking features: Garage - Detached
Features
- Exterior features: Stucco
Lot
- Size: 6,970 Square Feet
Details
- Parcel number: 1036408011000
Construction
Type & style
- Home type: SingleFamily
Materials
- Roof: Composition
Condition
- New construction: No
- Year built: 1921
Community & HOA
Location
- Region: Lincoln
Financial & listing details
- Price per square foot: $205/sqft
- Tax assessed value: $253,000
- Annual tax amount: $3,251
- Date on market: 10/7/2026
Estimated market value
Not available
Estimated sales range
Not available
$1,686/mo
Price history
| Date | Event | Price |
|---|---|---|
| 10/7/2026 | Listed for sale | $293,000+79.8%$205/sqft |
Source: Owner Report a problem | ||
| 5/16/2007 | Sold | $163,000+16.4%$114/sqft |
Source: Public Record Report a problem | ||
| 4/1/2002 | Sold | $140,000$98/sqft |
Source: Public Record Report a problem | ||
Public tax history
| Year | Property taxes | Tax assessment |
|---|---|---|
| 2025 | $3,251 +3.5% | $253,000 +11.3% |
| 2024 | $3,141 -17.5% | $227,300 |
| 2023 | $3,810 -8.6% | $227,300 +8.4% |
| 2022 | $4,170 -0.2% | $209,700 |
| 2021 | $4,179 +32.3% | $209,700 +26.9% |
| 2020 | $3,159 -5.2% | $165,300 |
| 2019 | $3,331 +10.7% | $165,300 +10.2% |
| 2018 | $3,009 +4.5% | $150,000 |
| 2017 | $2,879 +14.4% | $150,000 +16.1% |
| 2016 | $2,516 | $129,200 |
| 2015 | $2,516 +0.7% | $129,200 -6.2% |
| 2014 | $2,499 -6.8% | $137,800 |
| 2013 | $2,680 | $137,800 |
| 2012 | -- | $137,800 -1.4% |
| 2011 | -- | $139,700 |
| 2010 | -- | $139,700 |
| 2009 | -- | $139,700 -5% |
| 2008 | -- | $147,111 |
| 2007 | -- | $147,111 |
| 2006 | -- | $147,111 |
| 2005 | $2,678 +1.3% | -- |
| 2004 | $2,644 | -- |
| 2003 | $2,644 +14.4% | -- |
| 2002 | $2,311 +1% | -- |
| 2001 | $2,288 +7.3% | -- |
| 2000 | $2,132 | -- |
Find assessor info on the county website
Monthly payment
Est. payment
Payment breakdown
Explore the cost of this home by adjusting the details. Changes won't be saved.Climate risks
Neighborhood: Indian Village


Similar homes
- $285,0003 bd2 ba1.9k sqft1416 Van Dorn St, Lincoln, NE 68502For Sale
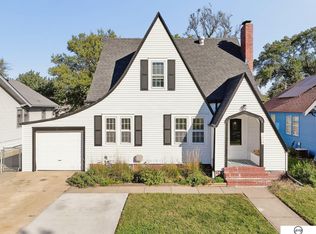
 MLS ID #22629753, Holly Martin, Giving Realty. GPRMLS
- $289,0003 bd2 ba1.7k sqft2810 Cable Ave, Lincoln, NE 68502For Sale
 MLS ID #22630030, Reina Day, REMAX Concepts. GPRMLS
- $299,0003 bd3 ba1.5k sqft1436 Cheyenne St, Lincoln, NE 68502For Sale
 MLS ID #22616809, Brandon Allen, Woods Bros Realty. GPRMLS
- $269,0004 bd2 ba1.9k sqft1840 Perkins Blvd, Lincoln, NE 68502For Sale
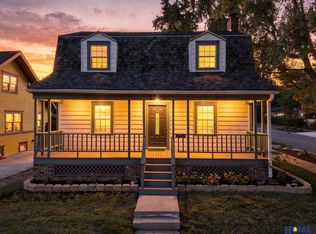 MLS ID #22629875, Jeffrey Searcy, HOME Real Estate. GPRMLS
- $277,0004 bd2 ba2k sqft2400 Bradfield Dr, Lincoln, NE 68502For SaleMLS ID #22629665, Danny Poethig, BHHS Ambassador Real Estate. GPRMLS
- $259,9004 bd2 ba1.7k sqft634 Washington St, Lincoln, NE 68502For SaleMLS ID #22629637, Joslyn Brinkman, SimpliCity Real Estate. GPRMLS
- $327,0003 bd2 ba1.8k sqft3005 S 27th St, Lincoln, NE 68502For SaleMLS ID #22629756, Tafe Sup Bergo, Woods Bros Realty. GPRMLS
- $270,0003 bd3 ba1.8k sqft2810 S 11th St, Lincoln, NE 68502For SaleMLS ID #22628513, Jennifer Lewis, Nebraska Realty. GPRMLS
- $278,5003 bd2 ba1.5k sqft1981 Ryons St, Lincoln, NE 68502For SaleMLS ID #22627621, Joe Millard, Red Door Realty. GPRMLS
- $310,0004 bd2 ba1.8k sqft1825 Ryons St, Lincoln, NE 68502For SaleMLS ID #22627788, Reina Day, REMAX Concepts. GPRMLS
- $335,0002 bd1 ba1.2k sqft1801 Kings Hwy, Lincoln, NE 68502For SaleMLS ID #22628423, Josie Tidball, Giving Realty. GPRMLS
- $289,0004 bd2 ba2k sqft2531 Woods Blvd, Lincoln, NE 68502For SaleMLS ID #22623068, Mark Faatz, Nebraska Realty. GPRMLS
- $259,9004 bd2 ba2k sqft2111 Harwood St, Lincoln, NE 68502For SaleMLS ID #22629371, Rocio Cubas, Coldwell Banker NHS R E. GPRMLS
- $325,0003 bd3 ba2k sqft2828 Cedar Ave, Lincoln, NE 68502For SaleMLS ID #22629409, Kimberly Rempel, HOME Real Estate. GPRMLS
- $269,9003 bd2 ba1.8k sqft2709 S 12th St, Lincoln, NE 68502For SaleMLS ID #22627922, Amy Fredrick, Home Smart Realty. GPRMLS
- $245,0003 bd2 ba1.8k sqft2539 Woods Blvd, Lincoln, NE 68502For SaleMLS ID #22629403, Amanda Wasser, Nebraska Realty. GPRMLS
- $325,0002 bd2 ba1.9k sqft2916 S 26th St, Lincoln, NE 68502For SaleMLS ID #22626284, Jayson Becker, BancWise Realty. GPRMLS
- $235,0002 bd2 ba1.5k sqft1609 S 26th St, Lincoln, NE 68502For SaleMLS ID #22628883, Evan Germansky, Pinnacle Realty Group. GPRMLS
- $279,0004 bd2 ba1.8k sqft1820 Brower Rd, Lincoln, NE 68502For SaleMLS ID #22614962, Leeann Bluske, Exchange Brokers. GPRMLS
