Positioned along a high-traffic in northeast Sacramento, this 1,581 sq ft commercial office building sits on a 7,405 sq ft lot an ideal opportunity for investors or owner-users looking to establish a presence in a well-trafficked area. The building features an efficient, functional layout with attractive wood and tile flooring throughout, giving the space a clean, professional feel. Two private rooms each come with their own private bathroom, offering flexibility for multi-use tenancy, private offices, or treatment/consultation-style setups. The location benefits from strong street visibility and easy access, with nearby shopping centers driving consistent area traffic. Whether you're looking to occupy, lease out, or hold as an investment, this property offers a rare combination of location, layout, and versatility in a growing sector.
Active
$559,000
2033 Marconi Ave, Sacramento, CA 95821
--beds
0baths
1,581sqft
Other
Built in 1936
-- sqft lot
$543,600 Zestimate®
$354/sqft
$-- HOA
What's special
Efficient functional layoutClean professional feelStrong street visibility
- 37 days
- 113
- 3
Zillow last checked:
Listing updated:
Listed by:
Mike Chen DRE #02037920 916-695-3872,
Keller Williams Realty
Source: MetroList Services of CA,MLS#: 226115579Originating MLS: MetroList Services, Inc.
Facts & features
Interior
Bedrooms & bathrooms
- Bathrooms: 0
Heating
- Central
Cooling
- Central Air
Appliances
- Laundry: Common Area, Washer/Dryer Hookups
Features
- Flooring: Wood
- Has fireplace: No
Interior area
- Total interior livable area: 1,581 sqft
Property
Parking
- Parking features: On Street
Lot
- Size: 7,405 Square Feet
- Features: Other
Details
- Parcel number: 26601700340000
- Zoning: C-2
- Special conditions: Standard
Construction
Type & style
- Home type: MultiFamily
- Property subtype: Other
Materials
- Stucco
- Foundation: Raised
Condition
- Year built: 1936
Utilities & green energy
- Sewer: Public Sewer
- Water: Public
- Utilities for property: City
Community & HOA
Location
- Region: Sacramento
Financial & listing details
- Price per square foot: $354/sqft
- Tax assessed value: $274,189
- Price range: $559K - $559K
- Date on market: 9/14/2026
- Income includes: Rent Only, Parking
Estimated market value
$543,600
$516,000 - $571,000
$1,786/mo
Price history
| Date | Event | Price |
|---|---|---|
| 9/14/2026 | Listed for sale | $559,000+127.2%$354/sqft |
Source: MetroList Services of CA #226115579 Report a problem | ||
| 7/25/2019 | Sold | $246,000+158.9%$156/sqft |
Source: Public Record Report a problem | ||
| 3/29/2013 | Sold | $95,000+128.9%$60/sqft |
Source: Public Record Report a problem | ||
| 8/29/2012 | Sold | $41,500-47.5%$26/sqft |
Source: Public Record Report a problem | ||
| 11/3/2011 | Listing removed | $695 |
Source: RentalHunt.com #208478 Report a problem | ||
| 10/26/2011 | Price change | $695-7.3% |
Source: RentalHunt.com #208478 Report a problem | ||
| 10/21/2011 | Listed for rent | $750 |
Source: RentalHunt.com #208478 Report a problem | ||
| 10/19/2011 | Listing removed | $79,000$50/sqft |
Source: ERA Mata Realty #11061718 Report a problem | ||
| 9/19/2011 | Listed for sale | $79,000+90.4%$50/sqft |
Source: ERA Mata Realty #11061718 Report a problem | ||
| 7/15/2011 | Sold | $41,500-41%$26/sqft |
Source: Public Record Report a problem | ||
| 4/19/2011 | Listed for sale | $70,300-9.8%$44/sqft |
Source: Better Homes and Gardens Mason Mcduffie Real Estate #10095600 Report a problem | ||
| 1/16/2011 | Listing removed | $77,900$49/sqft |
Source: Better Homes and Gardens Mason Mcduffie Real Estate #10095600 Report a problem | ||
| 1/7/2011 | Price change | $77,900-4.9%$49/sqft |
Source: Better Homes and Gardens Mason Mcduffie Real Estate #10095600 Report a problem | ||
| 12/17/2010 | Listed for sale | $81,900-2.5%$52/sqft |
Source: Better Homes and Gardens Mason Mcduffie Real Estate #10095600 Report a problem | ||
| 12/9/2010 | Sold | $84,000$53/sqft |
Source: Public Record Report a problem | ||
| 7/29/2010 | Sold | $84,000$53/sqft |
Source: Public Record Report a problem | ||
Public tax history
| Year | Property taxes | Tax assessment |
|---|---|---|
| 2026 | -- | $274,189 +2% |
| 2025 | $3,371 +0.2% | $268,813 +2% |
| 2024 | $3,365 +6.6% | $263,544 +2% |
| 2023 | $3,155 +0.6% | $258,377 +2% |
| 2022 | $3,137 +1.7% | $253,312 +2% |
| 2021 | $3,084 +1.9% | $248,346 +1% |
| 2020 | $3,026 +52.7% | $245,800 +57.3% |
| 2019 | $1,982 +1.4% | $156,217 +2% |
| 2018 | $1,955 +1% | $153,155 +2% |
| 2017 | $1,936 +6.9% | $150,153 +2% |
| 2016 | $1,812 +50.7% | $147,210 +51.2% |
| 2015 | $1,202 | $97,337 +2% |
| 2014 | $1,202 | $95,431 +130% |
| 2013 | -- | $41,500 |
| 2012 | -- | $41,500 -32.3% |
| 2011 | -- | $61,287 +0.8% |
| 2010 | -- | $60,830 +1.8% |
| 2008 | -- | $59,780 +2% |
| 2007 | -- | $58,609 +2% |
| 2006 | -- | $57,460 +2% |
| 2005 | -- | $56,335 +2% |
| 2004 | -- | $55,232 +1.9% |
| 2003 | -- | $54,221 +2% |
| 2002 | -- | $53,159 +2% |
| 2001 | -- | $52,118 +2% |
| 2000 | -- | $51,097 |
Find assessor info on the county website
Monthly payment
Est. payment
Payment breakdown
Explore the cost of this home by adjusting the details. Changes won't be saved.Climate risks
Neighborhood: Del Paso Park

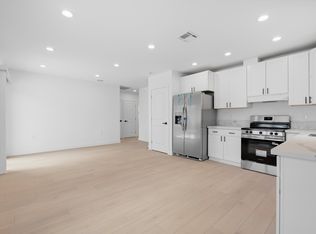

Similar homes
- $549,9994 bd2 ba1.8k sqft2321 Pamela Ln, Sacramento, CA 95825For Sale
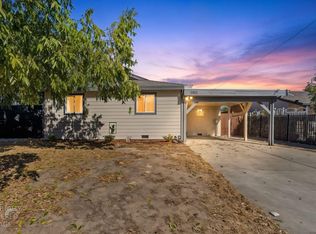 MLS ID #226128449, Dana Miller. MetroList Services of CA
- $619,0004 bd3 ba1.8k sqft3540 Lynne Way, Sacramento, CA 95821For Sale
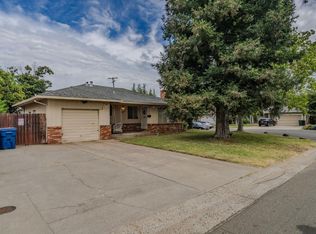 MLS ID #226083903, Erica Hutson. MetroList Services of CA
- $499,9993 bd2 ba1.6k sqft3424 Kentfield Dr, Sacramento, CA 95821For Sale
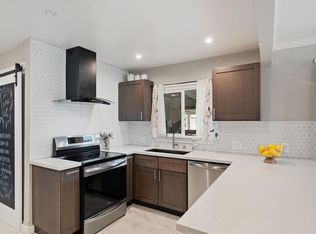 MLS ID #226119175, Dana Miller. MetroList Services of CA
- $538,0004 bd2 ba1.5k sqft3708 Merrily Way, Sacramento, CA 95821For Sale
 MLS ID #226109100, Mourice Mrabe. MetroList Services of CA
