Your dream home starts with the right piece of land! This rare frontage of 75’ offers room for a custom home, a 3 car garage, and a spacious backyard for entertainment.
This hard to find .29 acre lot is located moments away from downtown, the Metra Station, and is just a few steps away from the park. Inside award winning School District 205 with Hawthorne Elementary and Sandburg Middle School. York is nearby, bringing school events and Friday Night Games close to home.
Offered For Sale By Owner, this is a wonderful opportunity for both buyers and builders.
Lot Size: 75’x167’
For sale by owner
Street View
$629,000
204 N Glade Ave, Elmhurst, IL 60126
3beds
1,351sqft
SingleFamily
Built in 1913
0.29 Acres Lot
$422,600 Zestimate®
$466/sqft
$-- HOA
What's special
Spacious backyard for entertainment
- 1 day
- 175
- 4
Listed by:
Property Owner (224) 801-1421
Facts & features
Interior
Bedrooms & bathrooms
- Bedrooms: 3
- Bathrooms: 2
- Full bathrooms: 2
Features
- Basement: None
Interior area
- Total interior livable area: 1,351 sqft
Property
Parking
- Total spaces: 2
- Parking features: Garage - Detached
Lot
- Size: 0.29 Acres
Details
- Parcel number: 0603211027
Construction
Type & style
- Home type: SingleFamily
Materials
- special
Condition
- New construction: No
- Year built: 1913
Community & HOA
Location
- Region: Elmhurst
Financial & listing details
- Price per square foot: $466/sqft
- Tax assessed value: $136,060
- Annual tax amount: $7,412
- Date on market: 10/17/2026
Estimated market value
$422,600
$372,000 - $473,000
$3,193/mo
Price history
| Date | Event | Price |
|---|---|---|
| 10/17/2026 | Listed for sale | $629,000$466/sqft |
Source: Owner Report a problem | ||
Public tax history
| Year | Property taxes | Tax assessment |
|---|---|---|
| 2025 | $7,412 +4.1% | $136,060 +7.9% |
| 2024 | $7,120 +7.9% | $126,145 +8.1% |
| 2023 | $6,596 +2.5% | $116,650 +4% |
| 2022 | $6,436 +2.6% | $112,140 +2.6% |
| 2021 | $6,273 +4.1% | $109,350 +2.2% |
| 2020 | $6,028 +2.3% | $106,950 +5.2% |
| 2019 | $5,894 -5.9% | $101,680 -5.1% |
| 2018 | $6,263 +8% | $107,100 +4.9% |
| 2017 | $5,801 +2.6% | $102,050 +6.1% |
| 2016 | $5,652 +1.6% | $96,140 +7.3% |
| 2015 | $5,561 +20% | $89,570 +25.9% |
| 2014 | $4,635 +0.9% | $71,140 -1.4% |
| 2013 | $4,593 +0.1% | $72,150 -6.2% |
| 2012 | $4,588 +4% | $76,890 -7.9% |
| 2011 | $4,410 +1.5% | $83,480 -6.8% |
| 2010 | $4,345 +3.4% | $89,570 -6.8% |
| 2009 | $4,201 +5.8% | $96,110 |
| 2008 | $3,971 -4.2% | $96,110 +8.8% |
| 2007 | $4,145 +10.1% | $88,340 +16% |
| 2006 | $3,767 +2.4% | $76,150 +6.9% |
| 2005 | $3,679 +8.7% | $71,230 +6.3% |
| 2004 | $3,383 +0.3% | $67,010 +10.1% |
| 2003 | $3,373 +17.8% | $60,860 +32.7% |
| 2002 | $2,863 -18.2% | $45,870 -14.2% |
| 2001 | $3,498 +1.7% | $53,450 +5.2% |
| 2000 | $3,438 | $50,800 |
Find assessor info on the county website
Monthly payment
Est. payment
Payment breakdown
Explore the cost of this home by adjusting the details. Changes won't be saved.Climate risks
Neighborhood: 60126


Similar homes
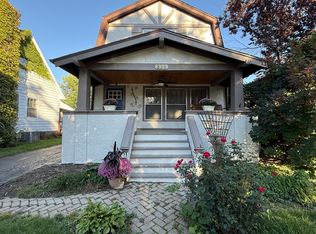
- $599,0004 bd3 ba1.5k sqft754 S Saylor Ave, Elmhurst, IL 60126New
 MLS ID #12787532, Charles Mueller, Equity Realty Partners, Inc.. MRED as distributed by MLS GRID
- $630,0003 bd2 ba1.4k sqft339 N Ridgeland Ave, Elmhurst, IL 60126Active
 MLS ID #12731973, John Morissette, Executive Realty Group LLC. MRED as distributed by MLS GRID
- $695,0004 bd3 ba1.7k sqft113 N Oak St, Elmhurst, IL 60126New
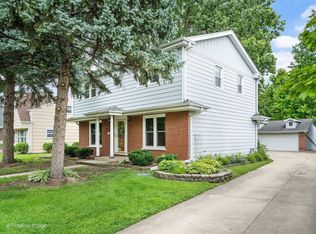 MLS ID #12784439, Kelly Stetler, Compass. MRED as distributed by MLS GRID
- $549,0003 bd2 ba1.6k sqft376 N West Ave, Elmhurst, IL 60126Active
 MLS ID #12777788, Sandra Mariottini, Fulton Grace Realty LLC. MRED as distributed by MLS GRID
