Great school district. School District 308 - Oswego East High School ranked 10/10.
Spacious house right across from the pond, beautiful water view from the 2 story living room, 9 feet ceiling on the first floor, kitchen with 42 inch cabinets and center island, 1st floor bedroom with full bath next to it, huge master suite with fireplace, vaulted ceiling, walk-in closet, master bath with double vanity, whirlpool tub and separate shower.
For sale by owner
$395,000
2267 Keating Dr, Aurora, IL 60503
4beds
2,563sqft
SingleFamily
Built in 2000
7,794 Square Feet Lot
$446,900 Zestimate®
$154/sqft
$19/mo HOA
What's special
Vaulted ceilingWhirlpool tubWalk-in closetSeparate shower
What the owner loves about this home
School District 308 - Oswego East High School ranked 10/10.
Spacious house right across from the pond, beautiful water view.
Convenient location to shopping, expressway, schools, and parks.
- 9 hours
- 117
- 4
Listed by:
Property Owner (630) 818-5476
Facts & features
Interior
Bedrooms & bathrooms
- Bedrooms: 4
- Bathrooms: 3
- Full bathrooms: 3
Heating
- Forced air, Gas
Cooling
- Central
Appliances
- Included: Dishwasher, Dryer, Microwave, Range / Oven, Refrigerator, Washer
- Laundry: In Unit
Features
- Flooring: Carpet
- Basement: Unfinished
- Has fireplace: Yes
Interior area
- Total interior livable area: 2,563 sqft
Property
Parking
- Total spaces: 2
- Parking features: Garage - Attached
Features
- Exterior features: Shingle, Vinyl
- Has view: Yes
- View description: Water
- Has water view: Yes
- Water view: Water
Lot
- Size: 7,794 Square Feet
Details
- Parcel number: 0701061020020000
Construction
Type & style
- Home type: SingleFamily
Materials
- Frame
- Roof: Asphalt
Condition
- New construction: No
- Year built: 2000
Community & HOA
HOA
- Has HOA: Yes
- HOA fee: $19 monthly
Location
- Region: Aurora
Financial & listing details
- Price per square foot: $154/sqft
- Tax assessed value: $417,093
- Annual tax amount: $12,118
- Date on market: 11/14/2026
Estimated market value
$446,900
$425,000 - $469,000
$3,362/mo
Price history
| Date | Event | Price |
|---|---|---|
| 11/14/2026 | Listed for sale | $395,000+64.6%$154/sqft |
Source: Owner Report a problem | ||
| 11/20/2021 | Listing removed | -- |
Source: Zillow Rental Manager Report a problem | ||
| 11/6/2021 | Listed for rent | $2,600+18.2%$1/sqft |
Source: Zillow Rental Manager Report a problem | ||
| 3/24/2021 | Listing removed | -- |
Source: Owner Report a problem | ||
| 10/5/2019 | Listing removed | $2,200$1/sqft |
Source: Owner Report a problem | ||
| 6/25/2019 | Listed for rent | $2,200$1/sqft |
Source: Owner Report a problem | ||
| 10/21/2017 | Listing removed | $2,200$1/sqft |
Source: Owner Report a problem | ||
| 8/25/2017 | Listed for rent | $2,200-4.3%$1/sqft |
Source: Owner Report a problem | ||
| 1/27/2017 | Listing removed | $2,300$1/sqft |
Source: Owner Report a problem | ||
| 1/23/2017 | Listed for rent | $2,300$1/sqft |
Source: Owner Report a problem | ||
| 1/20/2017 | Sold | $240,000-4%$94/sqft |
Source:  MRED as distributed by MLS GRID #09334930 Report a problem | ||
| 12/23/2016 | Pending sale | $249,900$98/sqft |
Source: RE/MAX Action #09334930 Report a problem | ||
| 11/11/2016 | Price change | $249,900-3.1%$98/sqft |
Source: RE/MAX Action #09334930 Report a problem | ||
| 10/14/2016 | Price change | $258,000-0.7%$101/sqft |
Source: RE/MAX Action #09334930 Report a problem | ||
| 9/7/2016 | Listed for sale | $259,900+1.9%$101/sqft |
Source: RE/MAX Action #09334930 Report a problem | ||
| 10/17/2003 | Sold | $255,000+1%$99/sqft |
Source: Public Record Report a problem | ||
| 2/2/2000 | Sold | $252,500$99/sqft |
Source: Public Record Report a problem | ||
Public tax history
| Year | Property taxes | Tax assessment |
|---|---|---|
| 2024 | $12,118 +3.5% | $139,031 +13.2% |
| 2023 | $11,708 +5.1% | $122,819 +9.7% |
| 2022 | $11,144 +0.3% | $111,987 +5% |
| 2021 | $11,109 +4.3% | $106,654 +1.6% |
| 2020 | $10,647 -1.2% | $104,964 +2.9% |
| 2019 | $10,779 -0.5% | $102,005 +3% |
| 2018 | $10,834 +8.2% | $99,029 +2.6% |
| 2017 | $10,011 -0.3% | $96,473 +2.2% |
| 2016 | $10,036 +2.2% | $94,396 +4% |
| 2015 | $9,817 | $90,765 +12.3% |
| 2014 | $9,817 +2.3% | $80,820 |
| 2013 | $9,597 +0.7% | $80,820 -3.4% |
| 2012 | $9,527 +2.8% | $83,677 -9.8% |
| 2011 | $9,263 +1.5% | $92,800 -6.5% |
| 2010 | $9,127 +8.7% | $99,234 -1.7% |
| 2009 | $8,399 -0.4% | $100,950 -1.4% |
| 2008 | $8,431 | $102,350 |
| 2007 | -- | $102,350 +15.9% |
| 2006 | $7,315 +5.7% | $88,340 +6.2% |
| 2005 | $6,921 -1.9% | $83,159 +1.3% |
| 2004 | $7,057 +11% | $82,100 +3.7% |
| 2003 | $6,355 | $79,184 |
Find assessor info on the county website
Monthly payment
Est. payment
Payment breakdown
Explore the cost of this home by adjusting the details. Changes won't be saved.Climate risks
Neighborhood: 60503
- $338,0003 bd3 ba1.9k sqft1912 Eastwick Ln, Aurora, IL 60503Sold

- $352,8003 bd2 ba1.6k sqft2815 Squaw Valley Trail Rent Only #000, Aurora, IL 60503Off Market
- $358,4003 bd2 ba1.6k sqft2815 Squaw Valley Rent Only #00, Trail Aurora, IL 60503Off Market
- $439,4003 bd7 ba1.8k sqft2800 Spinnaker Drive 4 Rent #1, Aurora, IL 60503Off Market
Similar homes
- $519,0004 bd3 ba2.4k sqft2223 Keim Dr, Aurora, IL 60503New
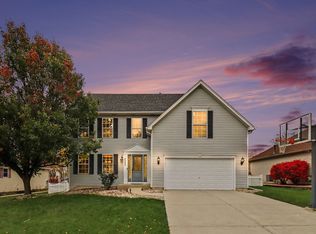 MLS ID #12807085, Venkateshwar Regulapati, Vernon Realty Inc.. MRED as distributed by MLS GRID
- $394,9993 bd3 ba1.7k sqft1793 Delta Dr, Aurora, IL 60503New
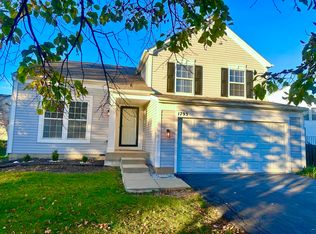 MLS ID #12806051, Naomi Koesler, Keller Williams Innovate - Aurora. MRED as distributed by MLS GRID
- $389,9003 bd2 ba1.7k sqft1938 Turtle Creek Ct #1938, Aurora, IL 60503New
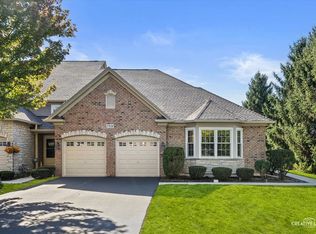 MLS ID #12808164, Lynn Purcell, Baird & Warner Fox Valley-Geneva. MRED as distributed by MLS GRID
- $402,0004 bd3 ba2k sqft2797 Yellowstone Dr, Aurora, IL 60503Active
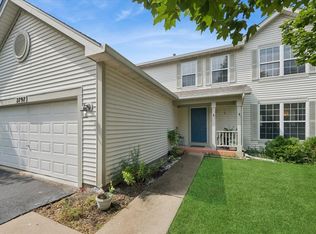 MLS ID #12726646, Liz Eder, Baird & Warner. MRED as distributed by MLS GRID
