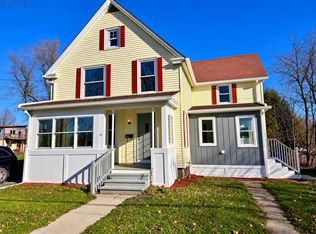
$46,000
-- bd-- ba1.6k sqft
Deerfield St, Greenfield, MA 01301
Off Market
Zillow last checked:
Listing updated:
Salim Abdoo 413-433-2170,
Naples Realty Group 413-650-1314
$356,700
$339,000 - $375,000
$2,623/mo
| Date | Event | Price |
|---|---|---|
| 11/9/2026 | Price change | $359,000-4.2%$240/sqft |
Source: MLS PIN #73589467 Report a problem | ||
| 10/12/2026 | Listed for sale | $374,900+134.3%$251/sqft |
Source: MLS PIN #73589467 Report a problem | ||
| 1/23/2026 | Sold | $160,000-5.9%$107/sqft |
Source: MLS PIN #73365156 Report a problem | ||
| 12/31/2025 | Contingent | $170,000$114/sqft |
Source: MLS PIN #73365156 Report a problem | ||
| 12/10/2025 | Price change | $170,000-5.6%$114/sqft |
Source: MLS PIN #73365156 Report a problem | ||
| 10/31/2025 | Price change | $180,000-5.3%$120/sqft |
Source: MLS PIN #73365156 Report a problem | ||
| 9/22/2025 | Price change | $190,000-5%$127/sqft |
Source: MLS PIN #73365156 Report a problem | ||
| 7/23/2025 | Price change | $200,000-4.8%$134/sqft |
Source: MLS PIN #73365156 Report a problem | ||
| 6/17/2025 | Price change | $210,000-4.5%$140/sqft |
Source: MLS PIN #73365156 Report a problem | ||
| 4/26/2025 | Listed for sale | $220,000+37.5%$147/sqft |
Source: MLS PIN #73365156 Report a problem | ||
| 7/29/2024 | Sold | $160,000+2%$107/sqft |
Source: Public Record Report a problem | ||
| 6/29/2007 | Sold | $156,900+74.3%$105/sqft |
Source: Public Record Report a problem | ||
| 2/1/2007 | Sold | $90,000+20%$60/sqft |
Source: Public Record Report a problem | ||
| 5/25/2006 | Sold | $75,000+29.3%$50/sqft |
Source: Public Record Report a problem | ||
| 4/19/2005 | Sold | $58,000+31.4%$39/sqft |
Source: Public Record Report a problem | ||
| 9/13/2004 | Sold | $44,140$30/sqft |
Source: Public Record Report a problem | ||
| Year | Property taxes | Tax assessment |
|---|---|---|
| 2025 | $3,881 -1.5% | $198,400 +2.6% |
| 2024 | $3,941 +10.8% | $193,300 +6.8% |
| 2023 | $3,557 +2.4% | $181,000 +16.2% |
| 2022 | $3,475 +2% | $155,700 +6.1% |
| 2021 | $3,406 +7% | $146,700 +5.7% |
| 2020 | $3,183 +6.4% | $138,800 +3.7% |
| 2019 | $2,992 +1.8% | $133,800 +2.1% |
| 2018 | $2,938 +3.2% | $131,000 |
| 2017 | $2,847 +5.8% | $131,000 +6.2% |
| 2016 | $2,691 +1.3% | $123,400 +4.6% |
| 2015 | $2,656 +9.6% | $118,000 |
| 2014 | $2,423 -0.3% | $118,000 +0.6% |
| 2013 | $2,430 -1.9% | $117,300 -10% |
| 2012 | $2,477 +1% | $130,300 -3.6% |
| 2011 | $2,453 0% | $135,200 -2.6% |
| 2010 | $2,454 +1% | $138,800 |
| 2009 | $2,429 +3.7% | $138,800 |
| 2008 | $2,343 +23.6% | $138,800 +25.3% |
| 2007 | $1,895 +4.9% | $110,800 +11.7% |
| 2006 | $1,807 -4.4% | $99,200 +0.2% |
| 2005 | $1,890 +19.8% | $99,000 +33.1% |
| 2003 | $1,578 +8.2% | $74,400 +8.3% |
| 2002 | $1,459 | $68,700 |

A local agent can set up tours, give advice and negotiate with sellers.