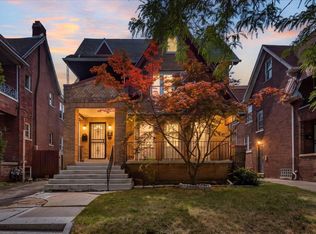
A rare brick 7 and 7 with each unit having FOUR bedrooms. This flat features updated kitchens and baths, fireplaces, some hardwood flooring, and it is freshly renovated. Super location just north of the Boston Edison Historic area! Easy access to freeways, Midtown, and Downtown Detroit. Solid opportunity to rent out a unit and occupy a unit, or rent both units out. We have multiple offers. Seller is requesting highest and best by noon this Thursday 10-29-26.
For sale
$184,900
2286 Calvert St, Detroit, MI 48206
8beds
3,402sqft
Duplex
Built in 1922
-- sqft lot
$-- Zestimate®
$54/sqft
$-- HOA
What's special
- 26 days
- 632
- 109
Zillow last checked:
Listing updated:
Listed by:
William J Adams 248-582-3300,
Adams Realty Services 248-582-3300
Source: Realcomp II,MLS#: 20261084412
Facts & features
Interior
Bedrooms & bathrooms
- Bedrooms: 8
- Bathrooms: 2
- Full bathrooms: 2
Heating
- Hot Water, Natural Gas
Features
- Basement: Full,Unfinished
- Has fireplace: No
Interior area
- Total interior livable area: 3,402 sqft
- Finished area above ground: 3,402
Property
Features
- Levels: Two
- Stories: 2
- Pool features: None
Lot
- Size: 5,662 Square Feet
- Dimensions: 40 x 137.17
Details
- Parcel number: W10I003051S
- Zoning description: Residential
- Special conditions: Short Sale No,Standard
Construction
Type & style
- Home type: MultiFamily
- Architectural style: Duplex
- Property subtype: Duplex
Materials
- Brick
- Foundation: Basement, Brick Mortar
Condition
- New construction: No
- Year built: 1922
Utilities & green energy
- Sewer: Public Sewer
- Water: Public
Community & HOA
Community
- Subdivision: JOY FARM ALSO P39
Location
- Region: Detroit
Financial & listing details
- Price per square foot: $54/sqft
- Tax assessed value: $45,317
- Annual tax amount: $5,828
- Date on market: 10/19/2026
- Cumulative days on market: 26 days
- Listing agreement: Exclusive Right To Sell
- Listing terms: Cash,Conventional
Estimated market value
Not available
Estimated sales range
Not available
$1,265/mo
Price history
| Date | Event | Price |
|---|---|---|
| 10/19/2026 | Listed for sale | $184,900+85.1%$54/sqft |
Source:  Realcomp II #20261084412 Report a problem | ||
| 10/9/2026 | Listing removed | $1,250 |
Source: Zillow Rentals Report a problem | ||
| 9/28/2026 | Price change | $1,250+8.7% |
Source: Zillow Rentals Report a problem | ||
| 9/18/2026 | Listed for rent | $1,150-14.8% |
Source: Zillow Rentals Report a problem | ||
| 8/18/2026 | Listing removed | $1,350 |
Source: Zillow Rentals #20261037928 Report a problem | ||
| 8/2/2026 | Price change | $1,350-6.9% |
Source: Zillow Rentals #20261037928 Report a problem | ||
| 6/4/2026 | Listed for rent | $1,450-7.9% |
Source: Zillow Rentals Report a problem | ||
| 6/3/2026 | Listing removed | $1,575 |
Source: Zillow Rentals Report a problem | ||
| 4/21/2026 | Listed for rent | $1,575 |
Source: Zillow Rentals Report a problem | ||
| 1/16/2026 | Listing removed | $1,575 |
Source: Zillow Rentals Report a problem | ||
| 12/26/2025 | Listed for rent | $1,575 |
Source: Zillow Rentals Report a problem | ||
| 12/16/2025 | Listing removed | $1,575 |
Source: Zillow Rentals Report a problem | ||
| 6/6/2025 | Price change | $1,575-1.6% |
Source: Zillow Rentals Report a problem | ||
| 4/11/2025 | Listed for rent | $1,600+146.2% |
Source: Zillow Rentals Report a problem | ||
| 8/25/2023 | Pending sale | $99,900+17.5%$29/sqft |
Source: Realcomp II #20230042697 Report a problem | ||
| 8/24/2023 | Sold | $85,000-14.9%$25/sqft |
Source: Realcomp II #20230042697 Report a problem | ||
| 6/12/2023 | Price change | $99,900-13.1%$29/sqft |
Source: Realcomp II #20230042697 Report a problem | ||
| 5/31/2023 | Listed for sale | $115,000$34/sqft |
Source: Realcomp II #20230042697 Report a problem | ||
| 6/6/2016 | Listing removed | $650 |
Source: Blessed Rentals Report a problem | ||
| 3/7/2016 | Listed for rent | $650 |
Source: Blessed Rentals Report a problem | ||
Public tax history
| Year | Property taxes | Tax assessment |
|---|---|---|
| 2026 | -- | $67,600 +34.1% |
| 2025 | -- | $50,400 +47.4% |
| 2024 | -- | $34,200 +26.7% |
| 2023 | -- | $27,000 +23.3% |
| 2022 | -- | $21,900 +7.9% |
| 2021 | -- | $20,300 |
| 2020 | $2,450 +67.3% | $20,300 +5.7% |
| 2019 | $1,464 | $19,200 +5.5% |
| 2018 | $1,464 | $18,200 -12.9% |
| 2017 | -- | $20,900 -54.8% |
| 2016 | $1,221 | $46,200 +212.2% |
| 2015 | $1,221 -9.5% | $14,800 -28.2% |
| 2013 | $1,350 +10.5% | $20,613 -30.2% |
| 2010 | $1,221 | $29,535 -12% |
| 2009 | -- | $33,563 -10.5% |
| 2008 | -- | $37,501 |
| 2007 | -- | $37,501 +5.5% |
| 2005 | $135 | $35,546 +3% |
| 2004 | -- | $34,511 |
Find assessor info on the county website
Monthly payment
Est. payment
Payment breakdown
Explore the cost of this home by adjusting the details. Changes won't be saved.Climate risks
Neighborhood: Dexter-Linwood


Similar homes
- $199,0006 bd4 ba3.4k sqft3275 Webb St, Detroit, MI 48206For Sale
 MLS ID #26046733, Gustaf Andreasen, @properties Christie's Int'l. MichRIC
- $193,0006 bd3 ba2.6k sqft2988 Richton St, Detroit, MI 48206For Sale

 MLS ID #20261062642, Antwuan M Hawkins, Five Star Luxury Realty. Realcomp II
- $220,0006 bd2 ba2.4k sqft1975 Taylor St, Detroit, MI 48206For Sale
 MLS ID #20261088808, Michael Gerisch, Century 21 Curran & Oberski. Realcomp II
- $187,0006 bd2 ba2.1k sqft3799 Pingree St, Detroit, MI 48206For Sale
 MLS ID #20261061017, Osavbie Usenvbuwa, Century 21 Curran & Oberski. Realcomp II
- $149,0006 bd2 ba2.8k sqft2480 Taylor St, Detroit, MI 48206For SaleMLS ID #20261089966, Demetrius Scott, KW Metro. Realcomp II
- $235,0006 bd2 ba2.6k sqft2475 Taylor St, Detroit, MI 48206For SaleMLS ID #20261088803, Shawn R Arnaout, @properties Christie's Int'l R E Rochester. Realcomp II
- $227,5006 bd3 ba3.2k sqft2015 Gladstone St, Detroit, MI 48206For SaleMLS ID #20261083954, Benjamin Ness, Clyde Realty LLC. Realcomp II
- $130,0008 bd2 ba3.3k sqft1714 Burlingame St, Detroit, MI 48206For SaleMLS ID #20261062127, Natashia Johnson, National Realty Centers, Inc. Realcomp II
- $234,9007 bd3 ba2.8k sqft3251 Calvert St, Detroit, MI 48206For SaleMLS ID #20261072436, Jessica Curmi, Clyde Realty LLC. Realcomp II
- $220,0008 bd3 ba3.9k sqft78 W Arizona St, Detroit, MI 48203For SaleMLS ID #20261089172, Michael Perna, EXP Realty The Perna Team. Realcomp II
- $250,0008 bd4 ba4.2k sqft1699 Atkinson St, Detroit, MI 48206For SaleMLS ID #20261074198, James Duncanson, eXp Realty Best Life and Company. Realcomp II
- $265,0008 bd4 ba3.5k sqft3235 Monterey St, Detroit, MI 48206For SaleMLS ID #20261065042, Drake O'Donnell, NATOD Management. Realcomp II
- $179,9006 bd2 ba3.7k sqft12744-46 Stoepel St, Detroit, MI 48238For SaleMLS ID #20251048382, Darren Johnson, Johnson Premier Realty Co. Realcomp II
- $244,9006 bd2 ba2.3k sqft1933 Taylor St, Detroit, MI 48206For SaleMLS ID #20261086553, Garrett Blair, Douglas Rose Realty. Realcomp II
- $184,9996 bd2 ba1.9k sqft6643 Barlum St, Detroit, MI 48210For SaleMLS ID #20261080610, Roberto Ortiz, Las Casas Real Estate LLC. Realcomp II
- $210,0006 bd3 ba2.6k sqft3803 Tyler St, Detroit, MI 48238For SaleMLS ID #20261084114, Jasmine Broski, JP Dwellings. Realcomp II
- $168,0006 bd2 ba2.1k sqft4281 Duane St, Detroit, MI 48204For SaleMLS ID #20261061028, Joseph Hammel, Keller Williams Somerset. Realcomp II
- $212,0005 bd3 ba2.6k sqft3742 W Grand St, Detroit, MI 48238For SaleMLS ID #26057992, John Wallen, Michigan Dream Homes, LLC. MichRIC
- $199,9995 bd2 ba2.2k sqft4646 Pacific St, Detroit, MI 48204For SaleMLS ID #20261080598, Roberto Ortiz, Las Casas Real Estate LLC. Realcomp II
- $174,0005 bd3 ba3.9k sqft12668 Stoepel St, Detroit, MI 48221For SaleMLS ID #20261051123, Lashonne Joe Hardy, National Realty Centers, Inc. Realcomp II
