NEW ROOF installed JAN 2021!! Come check out this fantastic 3 bedroom/2.5 bathroom home with distant ocean views from each level. Featuring beautiful brazilian cherry floors, quartz countertops, custom cherry kitchen cabinets, stainless steel appliances, brocade textured ceiling, spacious living room, gas fireplace and a private backyard with a large entertainment deck. The master bedroom has it's own private ocean deck, two walk-in closets, jetted bath with separate shower and dual sinks. There's a 4th bonus room with skylight that would be perfect for a playroom, study, office or exercise room! There's also ample space with attached 2-car garage. The beach, restaurants, shopping & much more are just minutes away. Schedule your showing today!
Pre-foreclosure
Est. $634,700
235 NE 71st Pl, Newport, OR 97365
3beds
2baths
2,000sqft
SingleFamily
Built in 2005
9,583 Square Feet Lot
$634,700 Zestimate®
$317/sqft
$-- HOA
Overview
- 80 days
- 28
- 1
Facts & features
Interior
Bedrooms & bathrooms
- Bedrooms: 3
- Bathrooms: 2.5
Heating
- Forced air, Gas
Appliances
- Included: Dishwasher, Microwave, Refrigerator
Features
- Flooring: Other, Carpet
- Has fireplace: Yes
Interior area
- Total interior livable area: 2,000 sqft
Property
Parking
- Total spaces: 2
- Parking features: Garage - Attached
Features
- Levels: Two
- Exterior features: Wood, Cement / Concrete
- Has view: Yes
- View description: Water
- Has water view: Yes
- Water view: Water
Lot
- Size: 9,583 Square Feet
Details
- Parcel number: 101120BD0100000
- Zoning: R-4 Residential
Construction
Type & style
- Home type: SingleFamily
Materials
- Roof: Composition
Condition
- Year built: 2005
Utilities & green energy
- Electric: On Property
- Gas: On Property
- Sewer: City
Community & HOA
Location
- Region: Newport
Financial & listing details
- Price per square foot: $317/sqft
- Tax assessed value: $661,470
- Annual tax amount: $5,360
Foreclosure details
Estimated market value
$634,700
$597,000 - $679,000
$2,780/mo
Price history
| Date | Event | Price |
|---|---|---|
| 3/30/2021 | Sold | $499,000$250/sqft |
Source:  OCMLS #LC-91809 Report a problem | ||
| 2/11/2021 | Pending sale | $499,000$250/sqft |
Source: Coldwell Banker Professional Group Lincoln City #20-2011 Report a problem | ||
| 11/23/2020 | Listed for sale | $499,000$250/sqft |
Source: Coldwell Banker Professional Group Lincoln City #20-2011 Report a problem | ||
| 11/14/2020 | Pending sale | $499,000$250/sqft |
Source: Coldwell Banker Professional Group Lincoln City #20-2011 Report a problem | ||
| 11/10/2020 | Listed for sale | $499,000$250/sqft |
Source: Coldwell Banker Professional Group Lincoln City #20-2011 Report a problem | ||
| 10/22/2020 | Pending sale | $499,000$250/sqft |
Source: Coldwell Banker Professional Group Lincoln City #20-2011 Report a problem | ||
| 9/18/2020 | Listed for sale | $499,000$250/sqft |
Source: Coldwell Banker Professional Group Lincoln City #20-2011 Report a problem | ||
Public tax history
| Year | Property taxes | Tax assessment |
|---|---|---|
| 2025 | $5,360 +2.1% | $308,820 +3% |
| 2024 | $5,248 +2.4% | $299,830 +3% |
| 2023 | $5,124 +3.2% | $291,100 +3% |
| 2022 | $4,967 -1.3% | $282,630 +3% |
| 2021 | $5,032 +5.6% | $274,400 +3% |
| 2020 | $4,765 | $266,410 +3% |
| 2019 | -- | $258,660 +3% |
| 2018 | $4,557 | $251,130 +3% |
| 2017 | $4,557 +3.1% | $243,820 +3% |
| 2016 | $4,421 | $236,720 +3% |
| 2015 | $4,421 +10.3% | $229,830 +3% |
| 2014 | $4,007 | $223,140 +3% |
| 2013 | $4,007 +9.9% | $216,650 +3% |
| 2012 | $3,647 +3.2% | $210,340 +3% |
| 2011 | $3,535 +2.6% | $204,220 |
| 2010 | $3,445 +3.1% | $204,220 +6.1% |
| 2009 | $3,340 +1.7% | $192,510 |
| 2008 | $3,285 +3.5% | $192,510 +6.1% |
| 2007 | $3,174 | $181,470 |
Find assessor info on the county website
Monthly payment
Climate risks
Neighborhood: 97365


Similar homes
- $599,0004 bd3 ba2.4k sqft7115 NE Benton Pl, Newport, OR 97365For Sale
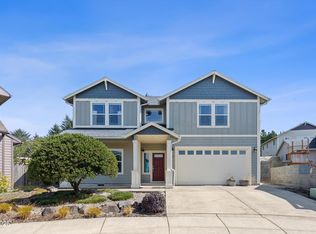
 MLS ID #LC-102838, Dennis M Regen, Taylor & Taylor Realty Company. OCMLS
- $550,0004 bd3 ba2.4k sqft195 NE 71st St, Newport, OR 97365For Sale
 MLS ID #26-1375, Jenn Tenderella, Premiere Property Group, LLC (Newport). OCMLS
- $698,7503 bd3 ba2.5k sqft267 SE John Nye Rd, Newport, OR 97365For Sale
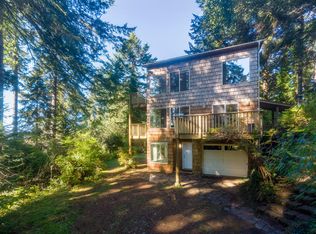 MLS ID #26-2789, Timothy Myrick, Advantage Real Estate. OCMLS
- $479,0003 bd4 ba2.5k sqft323 NE San Bayo Cir, Newport, OR 97365Active
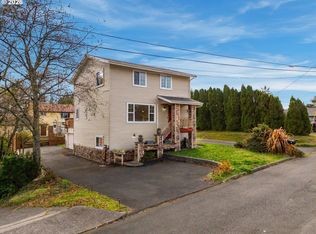
 MLS ID #625939681, Dennis Regen, Taylor & Taylor Realty Co.. RMLS (OR)
- $479,0003 bd4 ba2.5k sqft323 NE San-bay-o Cir, Newport, OR 97365For SaleMLS ID #26-2795, Dennis M Regen, Taylor & Taylor Realty Company. OCMLS
- $649,0003 bd2 ba1.7k sqft561 W Olive St, Newport, OR 97365For Sale
 MLS ID #843292, STACEY CLENDENIN, More Realty. WVMLS
- $699,0003 bd3 ba2.3k sqft11402 NE Coos St, Newport, OR 97365For SaleMLS ID #26-349, Doretta L Smith, Martek Real Estate. OCMLS
- $740,0003 bd4 ba2.8k sqft556 NW 56th St, Newport, OR 97365For SaleMLS ID #26-2406, Heidi Rogers, Cascade Hasson SIR. OCMLS
- $529,0003 bd3 ba1.9k sqft327 NW 56th St, Newport, OR 97365For SaleMLS ID #26-1985, Chantelle Charpentier, Martek Real Estate. OCMLS
- $715,0002 bd3 ba2.2k sqft2410 NW Pacific St, Newport, OR 97365For SaleMLS ID #26-2301, Wendy Howerton Birchfield, Windermere West Coast Properties. OCMLS
- $675,0003 bd3 ba2.6k sqft1565 SE Running Springs Ct, Newport, OR 97365For SaleMLS ID #843393, ERICKA FOWLER, Town & Country Sotheby's International Realty. WVMLS
- $660,0004 bd4 ba2.5k sqft2823 NE Jackson Pl, Newport, OR 97365For SaleMLS ID #26-2580, Hidi Cortes, Martek Real Estate. OCMLS
- $799,0003 bd3 ba1.9k sqft821 SE Vista Dr, Newport, OR 97365For SaleMLS ID #26-2641, Hannah Katz, Coldwell Banker Professional Group - Lincoln City. OCMLS
- $545,0002 bd3 ba1.7k sqft11408 NE Coos St, Newport, OR 97365For SaleMLS ID #26-2716, Kelley Mabbitt, Martek Real Estate. OCMLS
- $625,0003 bd2 ba1.7k sqft6989 SW Surfland St, South Beach, OR 97366For SaleMLS ID #26-2720, Heidi Rogers, Cascade Hasson SIR. OCMLS
- $450,0003 bd2 ba1.1k sqft363 NE 8th St, Newport, OR 97365For SaleMLS ID #26-2783, Sonja S. Lovas, Martek Real Estate. OCMLS
- $595,0004 bd3 ba2.3k sqft1017 SW Elizabeth St, Newport, OR 97365For SaleMLS ID #26-714, April J Munoz-Valladolid, Coldwell Banker Professional Group - Newport. OCMLS
- $749,0004 bd3 ba2.2k sqft1055 NE Laurel St, Newport, OR 97365For SaleMLS ID #26-993, Shelly Heim, Advantage Real Estate. OCMLS
- $420,0003 bd2 ba1.7k sqft280 NE 69th Pl, Newport, OR 97365For SaleMLS ID #26-2300, Marilyn Grove, Advantage Real Estate. OCMLS
- $455,0004 bd2 ba1.7k sqft210 NE 69th Pl, Newport, OR 97365For SaleMLS ID #26-2291, Kylie Lynch, Premiere Property Group, LLC (Newport). OCMLS
