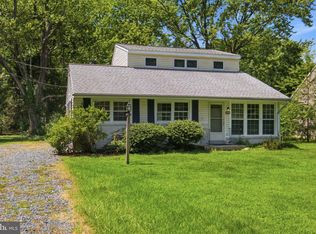
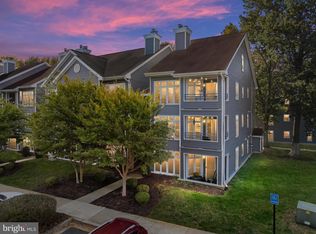
$339,000
2 bd2 ba1.2k sqft
24560 Deepwater Point Dr #1, St Michaels, MD 21663
Sold

Likely to sell faster than
Zillow last checked:
Listing updated:
Joan Wetmore 410-924-2432,
TTR Sotheby's International Realty 410-745-2596

Not available
Estimated sales range
Not available
Not available
| Date | Event | Price |
|---|---|---|
| 10/18/2024 | Sold | $329,000$254/sqft |
Source:  Bright MLS #MDTA2008570 Report a problem | ||
| 9/30/2024 | Contingent | $329,000$254/sqft |
Source: Bright MLS #MDTA2008570 Report a problem | ||
| 8/3/2024 | Listed for sale | $329,000-7.2%$254/sqft |
Source: Bright MLS #MDTA2008570 Report a problem | ||
| 7/11/2024 | Listing removed | -- |
Source: Bright MLS #MDTA2007720 Report a problem | ||
| 6/7/2024 | Price change | $354,500-3.8%$274/sqft |
Source: Bright MLS #MDTA2007720 Report a problem | ||
| 5/3/2024 | Price change | $368,500-3.7%$284/sqft |
Source: Bright MLS #MDTA2007720 Report a problem | ||
| 4/19/2024 | Listed for sale | $382,500+9.6%$295/sqft |
Source: Bright MLS #MDTA2007720 Report a problem | ||
| 5/9/2023 | Sold | $349,000$269/sqft |
Source: Bright MLS #MDTA2004984 Report a problem | ||
| 4/28/2023 | Pending sale | $349,000$269/sqft |
Source: Bright MLS #MDTA2004984 Report a problem | ||
| 3/18/2023 | Contingent | $349,000$269/sqft |
Source: Bright MLS #MDTA2004984 Report a problem | ||
| 3/15/2023 | Listed for sale | $349,000+18.3%$269/sqft |
Source: Bright MLS #MDTA2004984 Report a problem | ||
| 9/8/2021 | Sold | $295,000+43.9%$228/sqft |
Source: Public Record Report a problem | ||
| 10/28/2011 | Sold | $205,000-19.6%$158/sqft |
Source: Public Record Report a problem | ||
| 9/12/2008 | Sold | $255,000+138.3%$197/sqft |
Source: Public Record Report a problem | ||
| 10/8/1999 | Sold | $107,000-7%$83/sqft |
Source: Public Record Report a problem | ||
| 10/27/1997 | Sold | $115,000$89/sqft |
Source: Public Record Report a problem | ||
| Year | Property taxes | Tax assessment |
|---|---|---|
| 2026 | $2,894 +9.6% | $311,133 +7.8% |
| 2025 | $2,640 +12.7% | $288,500 +11.2% |
| 2024 | $2,342 +18.9% | $259,400 +12.6% |
| 2023 | $1,970 +23.3% | $230,300 +14.5% |
| 2022 | $1,598 +6.5% | $201,200 +0.4% |
| 2021 | $1,501 +0.5% | $200,300 +0.5% |
| 2020 | $1,494 +0.5% | $199,400 +0.5% |
| 2019 | $1,487 +5.7% | $198,500 +1.3% |
| 2018 | $1,407 +6.5% | $195,967 +1.3% |
| 2017 | $1,321 +7.7% | $193,433 +1.3% |
| 2016 | $1,227 | $190,900 |
| 2015 | $1,227 +3.1% | $190,900 |
| 2014 | $1,189 | $190,900 -10.8% |
| 2013 | -- | $214,100 |
| 2012 | -- | $214,100 |
| 2011 | -- | $214,100 -16.8% |
| 2010 | -- | $257,480 +12.9% |
| 2009 | -- | $228,026 +14.8% |
| 2008 | -- | $198,573 +17.4% |
| 2007 | -- | $169,120 +8.2% |
| 2006 | -- | $156,256 +9% |
| 2005 | -- | $143,393 +9.9% |
| 2004 | -- | $130,530 +4.4% |
| 2003 | -- | $125,082 +4.6% |
| 2002 | -- | $119,636 +4.8% |
| 2001 | -- | $114,190 |
Source: Bright MLS. This data may not be complete. We recommend contacting the local school district to confirm school assignments for this home.
A local agent can set up tours, give advice and negotiate with sellers.
A local lender can help you make sure your offer is ready when you are.