This 1091 square foot single family home has 2 bedrooms and 1.0 bathrooms. This home is located at 258 NE 3rd Ave, Canby, OR 97013.
Pre-foreclosure
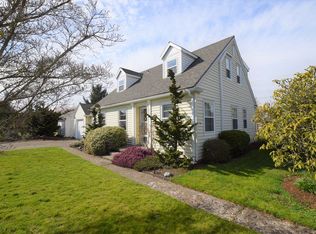
Street View
Est. $408,700
258 NE 3rd Ave, Canby, OR 97013
2beds
1baths
1,091sqft
SingleFamily
Built in 1925
6,098 Square Feet Lot
$408,700 Zestimate®
$375/sqft
$-- HOA
Overview
- 52 days |
- 22 |
- 0 |
Facts & features
Interior
Bedrooms & bathrooms
- Bedrooms: 2
- Bathrooms: 1
Heating
- Forced air
Interior area
- Total interior livable area: 1,091 sqft
Property
Features
- Exterior features: Other
Lot
- Size: 6,098 Square Feet
Details
- Parcel number: 00791192
Construction
Type & style
- Home type: SingleFamily
Materials
- Roof: Composition
Condition
- Year built: 1925
Community & HOA
Location
- Region: Canby
Financial & listing details
- Price per square foot: $375/sqft
- Tax assessed value: $346,212
- Annual tax amount: $2,885
Visit our professional directory to find a foreclosure specialist in your area that can help with your home search.
Find a foreclosure agentForeclosure details
Estimated market value
$408,700
$384,000 - $433,000
$2,131/mo
Price history
| Date | Event | Price |
|---|---|---|
| 12/22/2016 | Sold | $285,000+60.6%$261/sqft |
Source: Public Record Report a problem | ||
| 11/16/2005 | Sold | $177,500+70.7%$163/sqft |
Source: Public Record Report a problem | ||
| 11/21/1995 | Sold | $104,000$95/sqft |
Source: Public Record Report a problem | ||
Public tax history
| Year | Property taxes | Tax assessment |
|---|---|---|
| 2025 | $2,885 +2.9% | $162,854 +3% |
| 2024 | $2,804 +2.4% | $158,111 +3% |
| 2023 | $2,738 +6.2% | $153,506 +3% |
| 2022 | $2,579 +3.8% | $149,035 +3% |
| 2021 | $2,484 +1.8% | $144,695 +3% |
| 2020 | $2,439 +5% | $140,481 +3% |
| 2019 | $2,323 +2.3% | $136,390 +3% |
| 2018 | $2,271 | $132,417 +3% |
| 2017 | $2,271 +6.1% | $128,560 +3% |
| 2016 | $2,140 | $124,816 +3% |
| 2015 | $2,140 +3.6% | $121,181 +3% |
| 2014 | $2,066 +5.9% | $117,651 +3% |
| 2013 | $1,952 +3.3% | $114,224 +3% |
| 2012 | $1,890 +3% | $110,897 +3% |
| 2011 | $1,835 +44.2% | $107,667 +44.4% |
| 2010 | $1,273 -24.6% | $74,560 -24.4% |
| 2009 | $1,688 +7.8% | $98,562 +3% |
| 2008 | $1,567 +2.4% | $95,691 +3% |
| 2007 | $1,530 +4.1% | $92,904 +3% |
| 2006 | $1,470 -0.5% | $90,198 +3% |
| 2005 | $1,478 +1.5% | $87,571 +3% |
| 2004 | $1,456 +2.5% | $85,020 +3% |
| 2003 | $1,421 +3.6% | $82,544 +3% |
| 2002 | $1,371 +3.3% | $80,140 +3% |
| 2001 | $1,328 +3.8% | $77,806 +3% |
| 2000 | $1,280 | $75,540 |
Find assessor info on the county website
Monthly payment
Estimated monthly payment$1,822
All calculations are estimates and provided by Zillow, Inc. for informational purposes only. Actual amounts may vary.
HOA fees may include property taxes on listings classified as Co-Ops. Contact the listing agent and/or owner for fee details.
Mortgage interest rates are dependent on a number of factors, including credit score, down payment, and repayment length. Interest rate data provided by Zillow Group Marketplace, Inc. as of 1/1/1970 from various mortgage lenders with which we have lead or other similar arrangements; the Estimated Payment is an average of those rates.
See how much you could borrow to make a competitive offer.
Climate risks
Neighborhood: 97013
Nearby schools
GreatSchools rating
- 4/10William Knight Elementary SchoolGrades: K-6Distance: 0.3 mi
- 3/10Baker Prairie Middle SchoolGrades: 7-8Distance: 1.2 mi
- 7/10Canby High SchoolGrades: 9-12Distance: 0.7 mi


- Oregon
- Clackamas County
- Canby
- 97013
- 258 NE 3rd Ave
Nearby cities
Nearby zip codes
Other Canby Topics
