3 family with 5 rooms,, 2/3 bedrooms plus pantry on each floor. 3 modern bathrooms. laundry hookups on each floor. updated electrical service with house meter. all water plumbing has been replaced with new copper and plastic PEX pipong.3 recent gas water heaters Central heat first floor, 2nd and 3rd have gas heaters and some electric baseboards. Driveway with parking 3 cars comfortably. Webster Square area.. Property being conveyed in AS IS condition! Home Inspection is for buyer's use only! Serious buyers only, please! Showings -Sat 1-3pm only! Property fully rented!
For sale
$499,000
27 Cambridge St, Worcester, MA 01603
6beds
2,845sqft
3 Family
Built in 1890
-- sqft lot
$498,000 Zestimate®
$175/sqft
$-- HOA
What's special
Pantry on each floor
- 3 days
- 134
- 9
Zillow last checked:
Listing updated:
Listed by:
Malvina Dino Newell 978-342-7891,
Dino's Realty Team 978-342-7891
Source: MLS PIN,MLS#: 73598942
Facts & features
Interior
Bedrooms & bathrooms
- Bedrooms: 6
- Bathrooms: 3
- Full bathrooms: 3
Heating
- Forced Air, Natural Gas, Space Heater
Appliances
- Included: Range, Refrigerator
Features
- Pantry, Living Room, Dining Room, Kitchen
- Flooring: Varies, Hardwood
- Basement: Full
- Has fireplace: No
Interior area
- Total structure area: 2,845
- Total interior livable area: 2,845 sqft
- Finished area above ground: 2,845
Property
Parking
- Parking features: Off Street, Paved
- Has uncovered spaces: Yes
Features
- Patio & porch: Enclosed
Lot
- Size: 5,983 Square Feet
- Features: Other
Details
- Parcel number: 1770365
- Zoning: RG5
Construction
Type & style
- Home type: MultiFamily
- Property subtype: 3 Family
Materials
- Foundation: Stone
- Roof: Shingle
Condition
- Year built: 1890
Utilities & green energy
- Electric: Circuit Breakers, Common, Individually Metered
- Sewer: Public Sewer
- Water: Public
Community & HOA
Community
- Features: Public Transportation, Shopping
Location
- Region: Worcester
Financial & listing details
- Price per square foot: $175/sqft
- Tax assessed value: $446,100
- Annual tax amount: $5,884
- Date on market: 11/4/2026
- Total actual rent: 3800
- Road surface type: Paved
Estimated market value
$498,000
$473,000 - $523,000
$2,637/mo
Price history
| Date | Event | Price |
|---|---|---|
| 11/4/2026 | Listed for sale | $499,000+1147.5%$175/sqft |
Source: MLS PIN #73598942 Report a problem | ||
| 6/6/2012 | Sold | $40,000-55.1%$14/sqft |
Source: Public Record Report a problem | ||
| 5/29/2011 | Listing removed | $89,000$31/sqft |
Source: Community Realty #71154540 Report a problem | ||
| 4/11/2011 | Listed for sale | $89,000-31.5%$31/sqft |
Source: Community Realty #71154540 Report a problem | ||
| 10/2/2010 | Listing removed | $130,000$46/sqft |
Source: Sherrell Prefontaine #71031662 Report a problem | ||
| 7/28/2010 | Price change | $130,000+99900%$46/sqft |
Source: Sherrell Prefontaine #71031662 Report a problem | ||
| 7/20/2010 | Price change | $130-99.9% |
Source: Sherrell Prefontaine #71031662 Report a problem | ||
| 4/24/2010 | Price change | $149,900-16.7%$53/sqft |
Source: Sherrell Prefontaine #71031662 Report a problem | ||
| 3/20/2010 | Price change | $179,900-10%$63/sqft |
Source: Sherrell Prefontaine #71031662 Report a problem | ||
| 2/13/2010 | Listed for sale | $199,900-20%$70/sqft |
Source: Sherrell Prefontaine #71031662 Report a problem | ||
| 1/4/2006 | Sold | $250,000+150%$88/sqft |
Source: Public Record Report a problem | ||
| 10/31/1990 | Sold | $100,000$35/sqft |
Source: Public Record Report a problem | ||
Public tax history
| Year | Property taxes | Tax assessment |
|---|---|---|
| 2025 | $5,884 +2.3% | $446,100 +6.7% |
| 2024 | $5,749 +8.2% | $418,100 +12.8% |
| 2023 | $5,314 +11.6% | $370,600 +18.4% |
| 2022 | $4,762 +23.2% | $313,100 +31.9% |
| 2021 | $3,865 +6.3% | $237,400 +11% |
| 2020 | $3,636 +23.2% | $213,900 +30.4% |
| 2019 | $2,952 -1.8% | $164,000 +3.2% |
| 2018 | $3,005 +4.8% | $158,900 +6.5% |
| 2017 | $2,868 +37.9% | $149,200 +47.9% |
| 2016 | $2,080 +2.7% | $100,900 |
| 2015 | $2,025 +2.7% | $100,900 |
| 2014 | $1,972 -3.1% | $100,900 -7.9% |
| 2013 | $2,036 -12.4% | $109,600 -19.9% |
| 2012 | $2,325 +9.2% | $136,900 -2.6% |
| 2010 | $2,130 -11.6% | $140,600 -21.2% |
| 2009 | $2,410 -18.5% | $178,500 -24.3% |
| 2008 | $2,957 -1.3% | $235,800 -4.7% |
| 2007 | $2,995 -4.5% | $247,500 -1.1% |
| 2006 | $3,136 +15.7% | $250,300 +21.7% |
| 2005 | $2,711 +7.3% | $205,700 +20.1% |
| 2004 | $2,527 +34.2% | $171,300 +47% |
| 2003 | $1,883 +10.7% | $116,500 +22.2% |
| 2002 | $1,701 +48.3% | $95,300 +53.5% |
| 2000 | $1,147 -15.7% | $62,100 -14.8% |
| 1997 | $1,361 | $72,900 |
Find assessor info on the county website
Monthly payment
Est. payment
Payment breakdown
Explore the cost of this home by adjusting the details. Changes won't be saved.Climate risks
Neighborhood: 01603


Similar homes
- $519,9009 bd3 ba2.7k sqft29 Cambridge St, Worcester, MA 01603For Sale
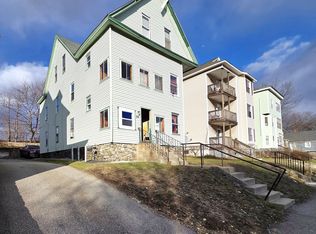 MLS ID #73599946, Ana Roque, Property Investors & Advisors, LLC. MLS PIN
- $299,9006 bd3 ba3.7k sqft3 Ives St, Worcester, MA 01603For Sale
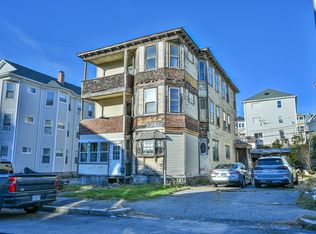 MLS ID #73598697, Jared Meehan, RE/MAX Bell Park Realty. MLS PIN
- $460,0004 bd2 ba1.9k sqft6 Hiscox St, Worcester, MA 01610For Sale
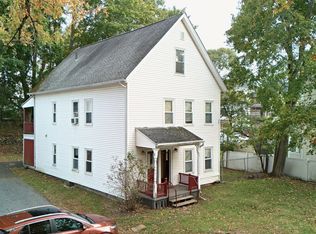 MLS ID #73598972, Pamela Andrade, Property Investors & Advisors, LLC. MLS PIN
- $--8 bd3 ba2.8k sqft141 Beacon St, Worcester, MA 01610Auction
 ServiceLink Auction
