FOURPLEX - All four units are 2 bed / 1 bath, with a mix of long-term and short-term income. Less than a mile from IU Health's new hospital opening in 2027, this is a great opportunity: value + transition from LTR to STR. Currently, units 1, 2, and 3 are leased long-term while unit 4 runs as a furnished successful rental! Tenants pay their own electric and gas, which are separately metered for each unit. Water and sewer are on one meter with bill back. Operating statements and pro forma available upon request.
Active
$400,000
2808 N Capitol Ave, Indianapolis, IN 46208
4beds
2baths
--sqft
Multi Family, Quadruplex, Apartment
Built in 1900
-- sqft lot
$-- Zestimate®
$--/sqft
$-- HOA
What's special
- 5 days
- 229
- 30
Zillow last checked:
Listing updated:
Listed by:
Kristin Glassburn kris@atpropertiesind.com,
@properties
Source: MIBOR as distributed by MLS GRID,MLS#: 22126251
Facts & features
Interior
Bedrooms & bathrooms
- Bedrooms: 4
- Bathrooms: 2
Heating
- Forced Air
Cooling
- Central Air, Separate Meters
Appliances
- Laundry: Common Laundry
Features
- Has basement: Yes
Property
Parking
- Total spaces: 2
- Parking features: Detached
- Garage spaces: 2
- Details: Unit Parking(On Street)
Features
- Levels: Two
- Stories: 2
- Has view: Yes
- View description: Downtown
Lot
- Size: 9,147 Square Feet
- Features: Not Applicable
Details
- Parcel number: 490626190002000101
- Zoning: D8
Construction
Type & style
- Home type: MultiFamily
- Architectural style: Other
- Property subtype: Multi Family, Quadruplex, Apartment
Materials
- Aluminum Siding
Condition
- Updated/Remodeled
- New construction: No
- Year built: 1900
Community & HOA
Community
- Subdivision: Burton & Campbells Park Place Add
Location
- Region: Indianapolis
Financial & listing details
- Tax assessed value: $411,300
- Annual tax amount: $9,876
- Date on market: 10/15/2026
- Cumulative days on market: 7 days
- Tenant pays: All Utilities
Estimated market value
Not available
Estimated sales range
Not available
Not available
Price history
| Date | Event | Price |
|---|---|---|
| 10/15/2026 | Listed for sale | $400,000+44.7% |
Source:  MIBOR as distributed by MLS GRID #22126251 Report a problem | ||
| 10/29/2021 | Listing removed | -- |
Source: Zillow Rental Manager Report a problem | ||
| 10/8/2021 | Listed for rent | $950-5% |
Source: Zillow Rental Manager Report a problem | ||
| 1/12/2021 | Listing removed | -- |
Source:  MIBOR as distributed by MLS GRID Report a problem | ||
| 1/10/2021 | Listed for rent | $1,000 |
Source: MIBOR as distributed by MLS GRID #21759964 Report a problem | ||
| 12/4/2020 | Sold | $276,500+0.5% |
Source: MIBOR as distributed by MLS GRID #21750272 Report a problem | ||
| 11/5/2020 | Pending sale | $275,000 |
Source: Elite Indy Realty Group #21750272 Report a problem | ||
| 11/2/2020 | Listed for sale | $275,000+103.7% |
Source: Elite Indy Realty Group #21750272 Report a problem | ||
| 11/27/2018 | Sold | $135,000-20.6% |
Source: MIBOR as distributed by MLS GRID #21573129 Report a problem | ||
| 11/12/2018 | Pending sale | $170,000 |
Source: Elite Indy Realty Group #21573129 Report a problem | ||
| 11/8/2018 | Listed for sale | $170,000 |
Source: Elite Indy Realty Group #21573129 Report a problem | ||
| 9/11/2018 | Pending sale | $170,000 |
Source: Elite Indy Realty Group #21573129 Report a problem | ||
| 8/14/2018 | Price change | $170,000-9.8% |
Source: Elite Indy Realty Group #21573129 Report a problem | ||
| 6/10/2018 | Listed for sale | $188,500+242.7% |
Source: Elite Indy Realty Group #21573129 Report a problem | ||
| 2/4/2012 | Listing removed | $55,000 |
Source: F. C. Tucker Company, Inc #21134043 Report a problem | ||
| 7/29/2011 | Listed for sale | $55,000-27.6% |
Source: F. C. Tucker Company, Inc #21134043 Report a problem | ||
| 6/26/2000 | Sold | $76,000 |
Source: MIBOR as distributed by MLS GRID #2001650 Report a problem | ||
Public tax history
| Year | Property taxes | Tax assessment |
|---|---|---|
| 2025 | $9,475 +40% | $411,300 +3% |
| 2024 | $6,767 +18.4% | $399,300 +40% |
| 2023 | $5,714 +12.3% | $285,300 +17.9% |
| 2022 | $5,089 -0.4% | $242,000 +9.7% |
| 2021 | $5,108 +95.8% | $220,600 |
| 2020 | $2,609 +16% | $220,600 +99.6% |
| 2019 | $2,249 +15% | $110,500 +17.1% |
| 2018 | $1,956 +4.6% | $94,400 +9.6% |
| 2017 | $1,871 +11.3% | $86,100 +6.2% |
| 2016 | $1,681 +3.9% | $81,100 +8.4% |
| 2014 | $1,617 -28.3% | $74,800 -26.5% |
| 2013 | $2,255 | $101,700 +1.4% |
| 2012 | $2,255 | $100,300 +14.1% |
| 2011 | -- | $87,900 |
| 2010 | $1,832 -2.4% | $87,900 |
| 2009 | $1,878 | $87,900 +7.1% |
| 2007 | -- | $82,100 -6.5% |
| 2006 | -- | $87,800 |
| 2005 | -- | $87,800 |
| 2004 | -- | $87,800 |
| 2003 | -- | $87,800 +179.6% |
| 2002 | -- | $31,400 +199.9% |
| 2000 | -- | $10,470 |
Find assessor info on the county website
Monthly payment
Est. payment
Payment breakdown
Explore the cost of this home by adjusting the details. Changes won't be saved.Climate risks
Neighborhood: Crown Hill
- $--2 bd1 ba900 sqft2808 N Capitol Ave APT 1, Indianapolis, IN 46208Off Market

- $153,9001 bd1 ba925 sqft2808 N Capitol Ave APT 4, Indianapolis, IN 46208Off Market

- $--3 bd1 ba900 sqft2808 N Capitol Ave APT 3, Indianapolis, IN 46208Off Market

- $--2 bd1 ba900 sqft2808 N Capitol Ave APT 2, Indianapolis, IN 46208Off Market

Similar homes
- $389,9007 bd5 ba-- sqft2918 N Kenwood Ave, Indianapolis, IN 46208Active
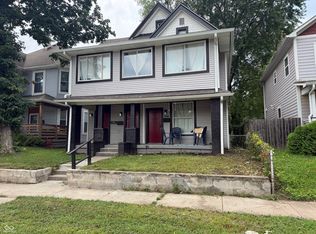 MLS ID #22120303, Corina Jones, Your Home Team. MIBOR as distributed by MLS GRID
- $400,0004 bd2 ba-- sqft2421 N Capitol Ave, Indianapolis, IN 46208Active
 MLS ID #22118086, Ely Berger, The Modglin Group. MIBOR as distributed by MLS GRID
- $359,9994 bd3 ba-- sqft713 W 32nd St, Indianapolis, IN 46208Active
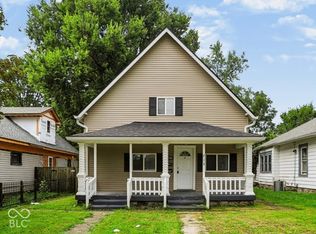 MLS ID #22129108, Shannon McGibboney, Carpenter, REALTORS®. MIBOR as distributed by MLS GRID
- $417,0004 bd2 ba-- sqft515 Sutherland Ave, Indianapolis, IN 46205Active
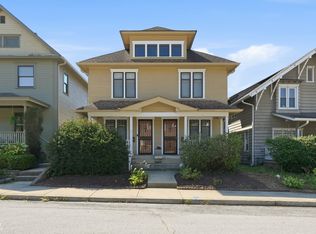 MLS ID #22124636, Dawn McClara, F.C. Tucker Company. MIBOR as distributed by MLS GRID
