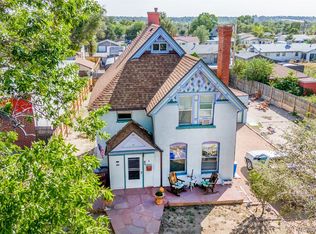
Clean and ready. 4 beds, 2 baths oversized one car garage. Fresh paint throughout home.
Pre-foreclosure
Est. $279,300
2816 5th Ave, Pueblo, CO 81003
4beds
1,329sqft
SingleFamily
Built in 1950
6,098 Square Feet Lot
$279,300 Zestimate®
$210/sqft
$-- HOA
Overview
- 55 days
- 14
- 0
Facts & features
Interior
Bedrooms & bathrooms
- Bedrooms: 4
- Bathrooms: 2
- Full bathrooms: 2
Heating
- Forced air
Features
- Ceiling Fan(s), Hardwood Floors, Window Coverings, Walk-in Shower
- Has fireplace: Yes
Interior area
- Total interior livable area: 1,329 sqft
Property
Parking
- Parking features: Garage - Detached
Features
- Exterior features: Stone, Brick
Lot
- Size: 6,098 Square Feet
Details
- Parcel number: 0524225008
Construction
Type & style
- Home type: SingleFamily
Materials
- masonry
- Roof: Composition
Condition
- Year built: 1950
Community & HOA
Location
- Region: Pueblo
Financial & listing details
- Price per square foot: $210/sqft
- Tax assessed value: $254,473
- Annual tax amount: $1,551
Foreclosure details
Estimated market value
$279,300
$265,000 - $293,000
$1,831/mo
Price history
| Date | Event | Price |
|---|---|---|
| 7/29/2022 | Sold | $285,000$214/sqft |
Source:  PAR #199621 Report a problem | ||
| 6/22/2022 | Pending sale | $285,000$214/sqft |
Source:  RE/MAX International #199621 Report a problem | ||
| 5/16/2022 | Listed for sale | $285,000$214/sqft |
Source: PAR #199621 Report a problem | ||
| 5/11/2022 | Pending sale | $285,000$214/sqft |
Source: RE/MAX International #199621 Report a problem | ||
| 4/22/2022 | Listed for sale | $285,000-3.4%$214/sqft |
Source: PAR #199621 Report a problem | ||
| 3/30/2022 | Listing removed | -- |
Source: RE/MAX International Report a problem | ||
| 3/29/2022 | Pending sale | $295,000$222/sqft |
Source: RE/MAX International #199621 Report a problem | ||
| 3/11/2022 | Listed for sale | $295,000+110.7%$222/sqft |
Source: PAR #199621 Report a problem | ||
| 1/21/2022 | Sold | $140,000+16.4%$105/sqft |
Source: Public Record Report a problem | ||
| 6/7/2018 | Sold | $120,250+4.6%$90/sqft |
Source: Public Record Report a problem | ||
| 4/19/2018 | Listed for sale | $115,000+27.8%$87/sqft |
Source: Jones-Healy Realtors #172854 Report a problem | ||
| 12/4/2014 | Sold | $90,000-5.3%$68/sqft |
Source: PAR #152151 Report a problem | ||
| 11/12/2014 | Price change | $95,000-4%$71/sqft |
Source: RE/MAX ASSOCIATES #152151 Report a problem | ||
| 10/9/2014 | Price change | $99,000-5.7%$74/sqft |
Source: RE/MAX ASSOCIATES #152151 Report a problem | ||
| 9/9/2014 | Price change | $105,000-3.7%$79/sqft |
Source: RE/MAX ASSOCIATES #152151 Report a problem | ||
| 8/9/2014 | Listed for sale | $109,000$82/sqft |
Source: RE/MAX ASSOCIATES #152151 Report a problem | ||
| 3/14/2011 | Listing removed | $850$1/sqft |
Source: Owner Report a problem | ||
| 3/9/2011 | Listed for rent | $850$1/sqft |
Source: Owner Report a problem | ||
Public tax history
| Year | Property taxes | Tax assessment |
|---|---|---|
| 2026 | $1,551 +12.3% | $17,304 +8.8% |
| 2025 | $1,380 -1.1% | $15,910 -12.2% |
| 2024 | $1,395 +33.8% | $18,120 -1% |
| 2023 | $1,043 -3.1% | $18,310 +70.9% |
| 2022 | $1,077 +20.3% | $10,713 -2.8% |
| 2021 | $895 -0.1% | $11,020 +22% |
| 2020 | $895 +55.7% | $9,035 +42.4% |
| 2018 | $575 | $6,346 |
| 2017 | $575 +96.3% | $6,346 -2% |
| 2016 | $293 | $6,474 |
| 2015 | $293 -55.2% | $6,474 -9.9% |
| 2014 | $653 -4.7% | $7,188 |
| 2013 | $685 -16% | $7,188 -3.9% |
| 2012 | $816 | $7,482 |
| 2011 | $816 +3.1% | $7,482 -13.8% |
| 2010 | $792 -4% | $8,684 -0.1% |
| 2009 | $825 -1.8% | $8,690 -2.6% |
| 2008 | $840 -1.1% | $8,920 |
| 2007 | $849 +4.5% | $8,920 +2.8% |
| 2006 | $813 +8.7% | $8,680 +13.6% |
| 2005 | $748 +1.4% | $7,640 |
| 2004 | $737 +2.7% | $7,640 -0.9% |
| 2003 | $718 +10.8% | $7,710 +1.8% |
| 2002 | $648 +10.7% | $7,570 +1.7% |
| 2001 | $585 | $7,440 |
Find assessor info on the county website
Monthly payment
Climate risks
Neighborhood: Country Club
Nearby schools
Schools provided by the listing agent
- District: 60
Source: The MLS. This data may not be complete. We recommend contacting the local school district to confirm school assignments for this home.


Similar homes
- $265,0004 bd2 ba1.7k sqft1007 W 14th St, Pueblo, CO 81003For Sale
 MLS ID #242815, Brandon A. Smith, Elite Home Sales & Property Management. PAR
- $--2 bd1 ba846 sqft2610 N Grand Ave, Pueblo, CO 81003Auction
 ServiceLink Auction
- $--3 bd2 ba1.3k sqft8 Loch Lomond Ln, Pueblo, CO 81001Auction
 Auction.com 2
- $--3 bd2 ba1.3k sqft1425 Tampico St, Pueblo, CO 81006Auction
 Auction.com 2
