Beautifully nestle in the heart of Westerly, with quick access to the highway making for an easy commute South to E. B., and Casinos and North to Quonset, Providence, and Boston. This home is nicely situated between Ann St and Niles St with driveways and access to both streets. This wonderful home boasts; low maintenance brick construction, new roof, solar panels, masonry fireplace, gleaming wood floors throughout, incredible masonry back patio, all package in a single floor easy ranch style living. The walkout lower-level includes a summer kitchen, full bath and studio, art, hobby, office room.
Active
$499,000
32 Ann St, Westerly, RI 02891
3beds
1,820sqft
Single Family Residence
Built in 1963
7,840 Square Feet Lot
$487,200 Zestimate®
$274/sqft
$-- HOA
What's special
Masonry fireplaceLow maintenance brick constructionSummer kitchenNew roofWalkout lower-levelGleaming wood floors throughoutSolar panels
- 10 days
- 1,244
- 64
Likely to sell faster than
Zillow last checked:
Listing updated:
Listed by:
David Cappucci 401-536-4161,
KEY Real Estate Services
Source: StateWide MLS RI,MLS#: 1426998
Facts & features
Interior
Bedrooms & bathrooms
- Bedrooms: 3
- Bathrooms: 2
- Full bathrooms: 2
Bathroom
- Features: Bath w Shower Stall, Bath w Tub & Shower
Heating
- Oil, Baseboard
Cooling
- None
Appliances
- Included: Tankless Water Heater
Features
- Wall (Dry Wall), Plumbing (Mixed), Insulation (Walls)
- Flooring: Ceramic Tile, Hardwood
- Doors: Storm Door(s)
- Windows: Insulated Windows
- Basement: Full,Interior and Exterior,Finished,Bath/Stubbed,Kitchen
- Number of fireplaces: 1
- Fireplace features: Brick
Interior area
- Total structure area: 1,144
- Total interior livable area: 1,820 sqft
- Finished area above ground: 1,144
- Finished area below ground: 676
Video & virtual tour
Property
Parking
- Total spaces: 4
- Parking features: Integral, Driveway
- Has attached garage: Yes
- Has uncovered spaces: Yes
Features
- Patio & porch: Patio, Porch
Lot
- Size: 7,840 Square Feet
Details
- Additional structures: Outbuilding
- Foundation area: 676
- Parcel number: WESTM36B122
- Zoning: R15
- Other equipment: Cable TV
Construction
Type & style
- Home type: SingleFamily
- Architectural style: Ranch
- Property subtype: Single Family Residence
Materials
- Dry Wall, Brick, Masonry
- Foundation: Block
Condition
- New construction: No
- Year built: 1963
Utilities & green energy
- Electric: 100 Amp Service
- Utilities for property: Sewer Connected, Water Connected
Green energy
- Energy generation: Solar
Community & HOA
Community
- Features: Golf, Highway Access, Hospital, Interstate, Marina, Public School, Railroad, Recreational Facilities
- Subdivision: Westerly
HOA
- Has HOA: No
Location
- Region: Westerly
Financial & listing details
- Price per square foot: $274/sqft
- Tax assessed value: $358,400
- Annual tax amount: $2,788
- Date on market: 11/2/2026
Estimated market value
$487,200
$463,000 - $512,000
$2,818/mo
Price history
| Date | Event | Price |
|---|---|---|
| 11/2/2026 | Listed for sale | $499,000+153.3%$274/sqft |
Source:  StateWide MLS RI #1426998 Report a problem | ||
| 10/3/2013 | Sold | $197,000-8.3%$108/sqft |
Source: Public Record Report a problem | ||
| 8/10/2013 | Price change | $214,900-4.5%$118/sqft |
Source: Randall, Realtors Real Living #1046189 Report a problem | ||
| 7/18/2013 | Listed for sale | $225,000+73.1%$124/sqft |
Source: Randall, Realtors Real Living #1046189 Report a problem | ||
| 7/6/2012 | Sold | $130,000$71/sqft |
Source: Public Record Report a problem | ||
| 3/22/2012 | Listed for sale | $130,000-44.6%$71/sqft |
Source: Re/Max Flagship #1012939 Report a problem | ||
| 12/17/2009 | Sold | $234,500$129/sqft |
Source: Agent Provided Report a problem | ||
Public tax history
| Year | Property taxes | Tax assessment |
|---|---|---|
| 2025 | $2,788 -0.1% | $358,400 +34.2% |
| 2024 | $2,791 +3.4% | $267,100 |
| 2023 | $2,698 | $267,100 |
| 2022 | $2,698 +2.6% | $267,100 +22.5% |
| 2021 | $2,629 +1.8% | $218,000 |
| 2020 | $2,583 +0.9% | $218,000 |
| 2019 | $2,559 +40.7% | $218,000 +11.1% |
| 2018 | $1,818 -22.8% | $196,300 |
| 2017 | $2,356 | $196,300 |
| 2016 | $2,356 -1.6% | $196,300 -8% |
| 2015 | $2,395 +1.6% | $213,300 |
| 2014 | $2,357 +1.7% | $213,300 +0.3% |
| 2013 | $2,318 -2.6% | $212,700 -9.7% |
| 2012 | $2,381 +1% | $235,500 |
| 2011 | $2,357 +3.2% | $235,500 |
| 2010 | $2,284 +5.8% | $235,500 -3.2% |
| 2009 | $2,159 | $243,400 |
| 2008 | $2,159 +3.2% | $243,400 |
| 2007 | $2,093 +12.5% | $243,400 +40.1% |
| 2006 | $1,860 +4.7% | $173,700 +0.8% |
| 2005 | $1,776 -2.5% | $172,400 +45.2% |
| 2003 | $1,822 | $118,700 |
Find assessor info on the county website
Monthly payment
Est. payment
Payment breakdown
Explore the cost of this home by adjusting the details. Changes won't be saved.Climate risks
Neighborhood: 02891


Similar homes
- $535,0004 bd3 ba2k sqft8 Pequot Ave, Westerly, RI 02891For Sale
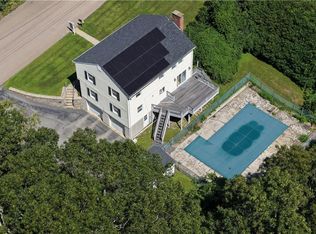
 MLS ID #1415908, Dan Liese, Seaport Real Estate Services. StateWide MLS RI
- $549,9002 bd1 ba1.7k sqft3 Pauline St, Westerly, RI 02891For Sale
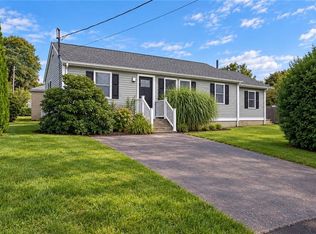 MLS ID #1423135, Paula Licciardi, RI Real Estate Services. StateWide MLS RI
- $529,9004 bd2 ba2.1k sqft11 Maybrey Dr, Westerly, RI 02891For Sale
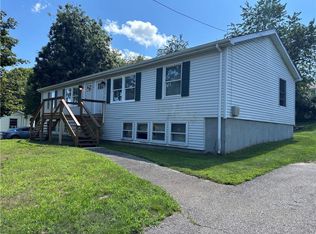 MLS ID #1420940, Lynn Azzinaro, RE/MAX South County. StateWide MLS RI
- $525,0003 bd2 ba1.3k sqft39 Riverdale Rd, Westerly, RI 02891For Sale
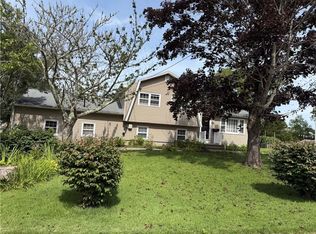 MLS ID #1422421, Gail McGinnis, Keller Williams Coastal. StateWide MLS RI
- $549,9003 bd2 ba1.6k sqft83 Elm Ridge Road, Stonington, CT 06379For Sale
 MLS ID #24119190, Thomas Switz, Switz Real Estate Associates. Smart MLS
- $495,0003 bd2 ba1.8k sqft483 Pendleton Hill Road, North Stonington, CT 06359For SaleMLS ID #24219028, Tom Drill, Coldwell Banker Realty. Smart MLS
- $512,5004 bd2 ba2.1k sqft65 Laurel St, Ashaway, RI 02804For SaleMLS ID #1426291, Richard Pinkhover, Addison Realty. StateWide MLS RI
- $625,0006 bd2 ba2.3k sqft14 Chord St, Westerly, RI 02891For SaleMLS ID #1427735, Celeste Santilli, BHHS New England Properties. StateWide MLS RI
- $529,0004 bd2 ba2.6k sqft160 Westerly Bradford Rd, Westerly, RI 02891For SaleMLS ID #1421912, Grace Williams, Dandurand Real Estate. StateWide MLS RI
- $500,0002 bd2 ba1.2k sqftClark St. Crossing, Westerly, RI 02891For SaleMLS ID #1427764, Adam Mancini, Ann McBride Real Estate, Inc.. StateWide MLS RI
- $599,9003 bd2 ba1.6k sqft11 Eddy Dr, Westerly, RI 02891For SaleMLS ID #1424656, Kimber Pope Kettlety, Coldwell Banker Coastal Homes. StateWide MLS RI
- $739,0003 bd2 ba2k sqft37 Forrestal Dr, Westerly, RI 02891For SaleMLS ID #1425313, Renee McCammon, BHHS New England Properties. StateWide MLS RI
- $729,0003 bd2 ba2.6k sqft3 Emerald St, Westerly, RI 02891For SaleMLS ID #1425144, Ben Faubert, Onshore Realtors. StateWide MLS RI
- $445,0004 bd2 ba1.4k sqft273 Alton Bradford Rd, Wood River Junction, RI 02894For SaleMLS ID #1427503, The Fraioli-Wilson Team, Edge Realty RI. StateWide MLS RI
- $599,0004 bd3 ba1.8k sqft10 Lofty Heights Rd, Westerly, RI 02891For SaleMLS ID #1421426, Maria Miller, Real Broker, LLC. StateWide MLS RI
- $499,0004 bd2 ba1.8k sqft209 Shannock Rd, South Kingstown, RI 02879For SaleMLS ID #1420434, The Mackinney Gold Group, SERHANT.. StateWide MLS RI
- $519,0002 bd1 ba1.7k sqft42 Charles Ave, Charlestown, RI 02813For SaleMLS ID #1415710, Gail McGinnis, Keller Williams Coastal. StateWide MLS RI
- $599,0004 bd3 ba2.5k sqft8 Penny Ct, Bradford, RI 02808For SaleMLS ID #1427007, Jim Abbott, Compass. StateWide MLS RI
- $475,0002 bd2 ba1.2k sqftWestwood, Westerly, RI 02891For SaleMLS ID #1427552, Mary Jane DiMaio Caraway, RE/MAX South County. StateWide MLS RI
- $454,9002 bd2 ba1.8k sqft543 Main St, Hopkinton, RI 02833For SaleMLS ID #1424515, Heather Burke, JPAR Prime Real Estate. StateWide MLS RI
