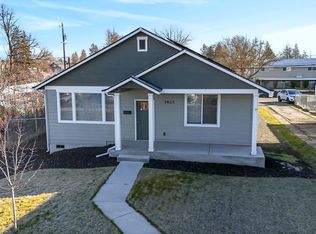
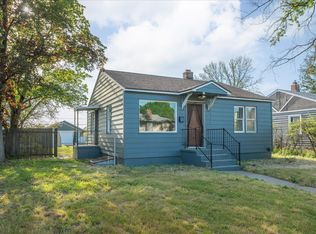
This 2500 square foot single family home has 4 bedrooms and 2.0 bathrooms. This home is located at 3918 N Maple St, Spokane, WA 99205.
Foreclosed
Est. $391,700
3918 N Maple St, Spokane, WA 99205
4beds
2baths
2,500sqft
SingleFamily
Built in 1910
7,190 Square Feet Lot
$391,700 Zestimate®
$157/sqft
$-- HOA
Overview
- 513 days |
- 60 |
- 2 |
Facts & features
Interior
Bedrooms & bathrooms
- Bedrooms: 4
- Bathrooms: 2
Heating
- Forced air
Cooling
- None
Features
- Basement: Partially finished
Interior area
- Total interior livable area: 2,500 sqft
Property
Parking
- Parking features: None, Garage
Lot
- Size: 7,190 Square Feet
Details
- Parcel number: 250113807
Construction
Type & style
- Home type: SingleFamily
Materials
- Roof: Composition
Condition
- Year built: 1910
Community & HOA
Location
- Region: Spokane
Financial & listing details
- Price per square foot: $157/sqft
- Tax assessed value: $417,900
- Annual tax amount: $4,146
Visit our professional directory to find a foreclosure specialist in your area that can help with your home search.
Find a foreclosure agentForeclosure details
Estimated market value
$391,700
$368,000 - $415,000
$2,164/mo
Price history
| Date | Event | Price |
|---|---|---|
| 1/29/2025 | Sold | $362,598-4.6%$145/sqft |
Source: Public Record Report a problem | ||
| 10/28/2024 | Listing removed | $380,000$152/sqft |
Source: | ||
| 6/14/2024 | Listed for sale | $380,000-3.6%$152/sqft |
Source: | ||
| 1/1/2024 | Listing removed | -- |
Source: | ||
| 8/18/2023 | Listing removed | -- |
Source: Zillow Rentals Report a problem | ||
| 8/8/2023 | Price change | $394,000-3.9%$158/sqft |
Source: | ||
| 8/5/2023 | Price change | $1,800-25%$1/sqft |
Source: Zillow Rentals Report a problem | ||
| 7/14/2023 | Listed for sale | $410,000-0.2%$164/sqft |
Source: | ||
| 7/8/2023 | Listing removed | -- |
Source: | ||
| 6/26/2023 | Price change | $2,400-7.7%$1/sqft |
Source: Zillow Rentals Report a problem | ||
| 6/5/2023 | Listed for rent | $2,600$1/sqft |
Source: Zillow Rentals Report a problem | ||
| 5/12/2023 | Price change | $411,000-3.3%$164/sqft |
Source: | ||
| 4/27/2023 | Price change | $425,000-2.3%$170/sqft |
Source: | ||
| 4/6/2023 | Listed for sale | $435,000+17.6%$174/sqft |
Source: | ||
| 5/11/2021 | Sold | $370,000$148/sqft |
Source: | ||
| 3/19/2021 | Pending sale | $370,000+10.4%$148/sqft |
Source: | ||
| 3/18/2021 | Price change | $335,000-4.3%$134/sqft |
Source: | ||
| 3/12/2021 | Listed for sale | $350,000$140/sqft |
Source: | ||
Public tax history
| Year | Property taxes | Tax assessment |
|---|---|---|
| 2024 | $4,146 +3.6% | $417,900 +1.2% |
| 2023 | $4,000 +2.2% | $412,900 +3.2% |
| 2022 | $3,914 +87% | $400,200 +100.4% |
| 2021 | $2,093 +4.2% | $199,700 +23% |
| 2020 | $2,009 +4535.7% | $162,300 +7.8% |
| 2019 | $43 | $150,500 +15.2% |
| 2018 | $43 -3.5% | $130,600 +15.2% |
| 2017 | $45 -5.3% | $113,400 +4.6% |
| 2016 | $47 -5.4% | $108,400 +5.2% |
| 2015 | $50 | $103,000 +1.8% |
| 2014 | $50 | $101,200 |
| 2013 | $50 -96.5% | -- |
| 2011 | $1,441 +3607.1% | -- |
| 2010 | $39 | -- |
| 2009 | $39 -97.2% | -- |
| 2008 | $1,411 | -- |
| 2007 | $1,411 +320.9% | $126,700 |
| 2005 | $335 +130.5% | -- |
| 2004 | $145 +0.6% | -- |
| 2003 | $145 | -- |
| 2002 | $145 +8.5% | -- |
| 2001 | $133 -86.9% | $65,500 |
| 1999 | $1,016 | $65,500 |
Find assessor info on the county website
Monthly payment
Estimated monthly payment$1,822
All calculations are estimates and provided by Zillow, Inc. for informational purposes only. Actual amounts may vary.
HOA fees may include property taxes on listings classified as Co-Ops. Contact the listing agent and/or owner for fee details.
Mortgage interest rates are dependent on a number of factors, including credit score, down payment, and repayment length. Interest rate data provided by Zillow Group Marketplace, Inc. as of 1/1/1970 from various mortgage lenders with which we have lead or other similar arrangements; the Estimated Payment is an average of those rates.
See how much you could borrow to make a competitive offer.
Climate risks
Neighborhood: North Hill
Nearby schools
GreatSchools rating
- 2/10Willard Elementary SchoolGrades: PK-5Distance: 0.7 mi
- 4/10Glover Middle SchoolGrades: 6-8Distance: 0.6 mi
- 6/10North Central High SchoolGrades: 6-12Distance: 1.7 mi


- Washington
- Spokane County
- Spokane
- 99205
- North Hill
- 3918 N Maple St
Nearby cities
Nearby neighborhoods
Nearby zip codes
Other Spokane Topics
