This 1800 square foot single family home has 3 bedrooms and 2.0 bathrooms. This home is located at 4215 W San Rafael St, Tampa, FL 33629.
Pre-foreclosure
Street View
Est. $609,000
4215 W San Rafael St, Tampa, FL 33629
3beds
1,800sqft
SingleFamily
Built in 1954
8,276 Square Feet Lot
$609,000 Zestimate®
$338/sqft
$-- HOA
Overview
- 37 days
- 47
- 3
Facts & features
Interior
Bedrooms & bathrooms
- Bedrooms: 3
- Bathrooms: 2
- Full bathrooms: 2
Heating
- Other, Electric
Cooling
- Central
Appliances
- Included: Dishwasher, Dryer, Freezer, Garbage disposal, Microwave, Range / Oven, Refrigerator, Trash compactor, Washer
Features
- Flooring: Tile, Carpet, Hardwood
- Has fireplace: No
Interior area
- Total interior livable area: 1,800 sqft
Property
Features
- Exterior features: Other
Lot
- Size: 8,276 Square Feet
Details
- Parcel number: 1829283QR000000000070A
Construction
Type & style
- Home type: SingleFamily
Materials
- masonry
- Roof: Composition
Condition
- Year built: 1954
Community & HOA
Location
- Region: Tampa
Financial & listing details
- Price per square foot: $338/sqft
- Tax assessed value: $463,199
- Annual tax amount: $2,753
Foreclosure details
Estimated market value
$609,000
$542,000 - $682,000
$4,118/mo
Price history
| Date | Event | Price |
|---|---|---|
| 4/23/2005 | Sold | $309,000+93.1%$172/sqft |
Source: Public Record Report a problem | ||
| 3/12/2004 | Sold | $160,000$89/sqft |
Source: Public Record Report a problem | ||
Public tax history
| Year | Property taxes | Tax assessment |
|---|---|---|
| 2025 | $2,753 +8% | $172,618 +2.9% |
| 2024 | $2,549 +3% | $167,753 +3% |
| 2023 | $2,473 +3.2% | $162,867 +3% |
| 2022 | $2,397 +1.6% | $158,123 +3% |
| 2021 | $2,358 +1.4% | $153,517 +1.4% |
| 2020 | $2,327 +2.5% | $151,397 +2.3% |
| 2019 | $2,269 | $147,993 +1.9% |
| 2018 | $2,269 +1.3% | $145,234 -39% |
| 2017 | $2,240 +2.1% | $238,133 +74.1% |
| 2016 | $2,195 +5.9% | $136,798 +0.7% |
| 2015 | $2,073 +1.2% | $135,847 +0.8% |
| 2014 | $2,048 +2.7% | $134,769 +1.5% |
| 2013 | $1,994 +0.7% | $132,777 +1.3% |
| 2012 | $1,980 -3.6% | $131,113 -2.4% |
| 2011 | $2,055 -8% | $134,360 -6.5% |
| 2010 | $2,235 +0.9% | $143,656 +1.1% |
| 2009 | $2,216 -37.5% | $142,120 -30% |
| 2008 | $3,546 -21.9% | $203,053 -13.7% |
| 2007 | $4,538 -6% | $235,284 +2.5% |
| 2006 | $4,826 +3.5% | $229,545 +19.7% |
| 2005 | $4,663 | $191,782 +22.8% |
| 2004 | -- | $156,111 +32.8% |
| 2003 | -- | $117,573 +3.4% |
| 2002 | -- | $113,706 +14.5% |
| 2001 | -- | $99,267 +4.7% |
| 2000 | $2,417 | $94,842 |
Find assessor info on the county website
Monthly payment
Climate risks
Neighborhood: Culbreath Heights

Similar homes
- $588,0003 bd2 ba1.1k sqft2801 S MANHATTAN AVENUE, TAMPA, FL 33629For Sale
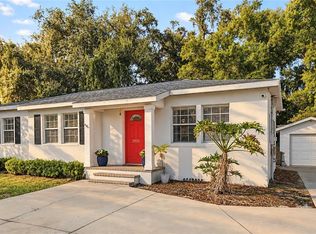
 MLS ID #TB8558567, Mike Grizzell, COMPASS FLORIDA LLC. Stellar MLS
- $649,9993 bd2 ba1.1k sqft3606 W BAY TO BAY BOULEVARD, TAMPA, FL 33629For Sale
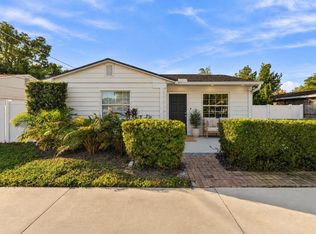 MLS ID #TB8558774, Shari Robertson, THE KAPLAN GROUP RE LLC. Stellar MLS
- $750,0003 bd2 ba1.4k sqft3611 W Kensington Ave, Tampa, FL 33629For Sale By Owner
- $765,0003 bd2 ba1.1k sqft3811 W TACON STREET, TAMPA, FL 33629For Sale
 MLS ID #TB8562208, Radek Knesl, SANDERS REALTY & APPRAISAL. Stellar MLS
- $749,9993 bd2 ba1.5k sqft4200 W EMPEDRADO STREET, TAMPA, FL 33629For SaleMLS ID #TB8556197, Devan Weisser, CENTURY 21 LIST WITH BEGGINS. Stellar MLS
- $730,0003 bd2 ba1.3k sqft1715 S HUBERT AVENUE, TAMPA, FL 33629For SaleMLS ID #TB8517733, Andrew Duncan, LPT REALTY LLC. Stellar MLS
- $770,0003 bd2 ba2.1k sqft1515 S WEST SHORE BOULEVARD, TAMPA, FL 33629For SaleMLS ID #O6434010, Karen Albright, OPENDOOR BROKERAGE LLC. Stellar MLS
- $725,0003 bd2 ba1.7k sqft2117 S WEST SHORE BOULEVARD, TAMPA, FL 33629For SaleMLS ID #TB8513082, Teresita Gonzalez, LANTES REAL ESTATE LLC. Stellar MLS
- $695,0002 bd1 ba1.1k sqft4713 W LEONA STREET, TAMPA, FL 33629For SaleMLS ID #TB8560237, Kevin Reeves, SMITH & ASSOCIATES REAL ESTATE. Stellar MLS
- $615,0004 bd2 ba1.8k sqft4317 S HALE AVENUE, TAMPA, FL 33611For SaleMLS ID #TB8558084, Khristian Marcotrigiano, 54 REALTY LLC. Stellar MLS
- $599,0004 bd2 ba1.6k sqft4420 W BAY COURT AVENUE, TAMPA, FL 33611For SaleMLS ID #TB8547168, Valeria Aliaga, NETWORTH REALTY OF TAMPA, LLC. Stellar MLS
- $724,9994 bd2 ba1.6k sqft4711 W EL PRADO BOULEVARD, TAMPA, FL 33629For SaleMLS ID #TB8557580, Becky Slocum, SMITH & ASSOCIATES REAL ESTATE. Stellar MLS
- $599,9993 bd2 ba1.7k sqft4416 W BAY COURT AVENUE, TAMPA, FL 33611For SaleMLS ID #TB8530126, Kristin Leon, COASTAL PROPERTIES GROUP INTERNATIONAL. Stellar MLS
- $829,0003 bd2 ba1.6k sqft2118 S VENUS STREET, TAMPA, FL 33629For SaleMLS ID #TB8560016, Leslie Sibbitt, COMPASS FLORIDA LLC. Stellar MLS
- $824,9003 bd2 ba1.5k sqft1104 S LOIS AVENUE, TAMPA, FL 33629For SaleMLS ID #TB8544889, Kathy Muscatell, KELLER WILLIAMS TAMPA PROPERTIES. Stellar MLS
- $899,0003 bd2 ba2.3k sqft4508 HENDERSON BOULEVARD, TAMPA, FL 33629For SaleMLS ID #TB8484034, Peter Wacelitz, IV, RE/MAX ALLIANCE GROUP. Stellar MLS
- $689,0002 bd1 ba1k sqft3914 W KENSINGTON AVENUE, TAMPA, FL 33629For SaleMLS ID #TB8560850, Kaylen Murkerson, QUICKSILVER REAL ESTATE GROUP. Stellar MLS
- $800,0002 bd2 ba1.3k sqft3816 W ESTRELLA STREET, TAMPA, FL 33629For SaleMLS ID #TB8555174, Jenny Brockwell, COLDWELL BANKER REALTY. Stellar MLS
- $729,0003 bd3 ba1.5k sqft3138 W EUCLID AVENUE, TAMPA, FL 33629For SaleMLS ID #TB8551471, Denita Serralles, COMPASS FLORIDA LLC. Stellar MLS
- $569,9003 bd2 ba1.2k sqft4232 W BAY VIEW AVENUE, TAMPA, FL 33611For SaleMLS ID #TB8551883, Michael Gutierrez, MCBRIDE KELLY & ASSOCIATES. Stellar MLS
