PRICE IMPROVEMENT --- Welcome to this well-maintained 1999 ranch at 424 Dennison Dr, Southbridge. This 2-bedroom, 1-bath home offers 976 sq ft of comfortable one-level living on a 0.39-acre lot. Recent updates include a new roof (2023) and new windows (2023), making this an energy-efficient home with major upkeep already done. The basement could easily be renovated into additional living space. Oil hot-water baseboard heat, city water and sewer.
Under contract
Price cut: $10K (10/31)
$350,000
424 Dennison Dr, Southbridge, MA 01550
2beds
976sqft
Single Family Residence
Built in 1999
0.39 Acres Lot
$368,900 Zestimate®
$359/sqft
$-- HOA
What's special
Oil hot-water baseboard heat
- 33 days
- 514
- 39
Likely to sell faster than
Zillow last checked:
Listing updated:
Listed by:
Tony Palmerino 774-230-5021,
Real Broker MA, LLC 855-450-0442
Source: MLS PIN,MLS#: 73590590
Facts & features
Interior
Bedrooms & bathrooms
- Bedrooms: 2
- Bathrooms: 1
- Full bathrooms: 1
Primary bedroom
- Level: First
Bedroom 2
- Level: First
Primary bathroom
- Features: No
Kitchen
- Level: First
Living room
- Level: First
Heating
- Baseboard, Oil
Cooling
- None
Appliances
- Included: Water Heater, Range, Dishwasher, Microwave, Refrigerator
- Laundry: In Basement
Features
- Basement: Full,Partially Finished,Walk-Out Access,Garage Access
- Has fireplace: No
Interior area
- Total structure area: 976
- Total interior livable area: 976 sqft
- Finished area above ground: 976
Property
Parking
- Total spaces: 4
- Parking features: Under, Off Street
- Attached garage spaces: 1
- Uncovered spaces: 3
Lot
- Size: 0.39 Acres
- Features: Sloped
Details
- Parcel number: M:0072 B:0025 L:B 00001,3980803
- Zoning: R1
Construction
Type & style
- Home type: SingleFamily
- Architectural style: Split Entry
- Property subtype: Single Family Residence
Materials
- Frame
- Foundation: Concrete Perimeter
- Roof: Shingle
Condition
- Year built: 1999
Utilities & green energy
- Electric: 100 Amp Service
- Sewer: Public Sewer
- Water: Public
Community & HOA
Community
- Features: Public Transportation, Shopping, Golf, Medical Facility, Laundromat, Public School
HOA
- Has HOA: No
Location
- Region: Southbridge
Financial & listing details
- Price per square foot: $359/sqft
- Tax assessed value: $307,700
- Annual tax amount: $4,582
- Date on market: 10/15/2026
- Listing terms: Contract
- Exclusions: Washer And Dryer Negotiable.
- Road surface type: Paved
Estimated market value
$368,900
$350,000 - $387,000
$2,000/mo
Price history
| Date | Event | Price |
|---|---|---|
| 11/6/2026 | Contingent | $350,000$359/sqft |
Source: MLS PIN #73590590 Report a problem | ||
| 10/31/2026 | Price change | $350,000-2.8%$359/sqft |
Source: MLS PIN #73590590 Report a problem | ||
| 10/22/2026 | Price change | $360,000-1.4%$369/sqft |
Source: MLS PIN #73590590 Report a problem | ||
| 10/14/2026 | Listed for sale | $365,000+21.7%$374/sqft |
Source: MLS PIN #73590590 Report a problem | ||
| 4/24/2023 | Sold | $300,000+0%$307/sqft |
Source: MLS PIN #73085442 Report a problem | ||
| 3/15/2023 | Contingent | $299,900$307/sqft |
Source: MLS PIN #73085442 Report a problem | ||
| 3/8/2023 | Listed for sale | $299,900+62.1%$307/sqft |
Source: MLS PIN #73085442 Report a problem | ||
| 11/20/2017 | Sold | $185,000-2.1%$190/sqft |
Source: Public Record Report a problem | ||
| 9/27/2017 | Pending sale | $189,000$194/sqft |
Source: RE/MAX ACCLAIM (OXFORD) #72230656 Report a problem | ||
| 9/19/2017 | Listed for sale | $189,000+67.4%$194/sqft |
Source: RE/MAX Acclaim #72230656 Report a problem | ||
| 7/5/2000 | Sold | $112,900+13%$116/sqft |
Source: Public Record Report a problem | ||
| 11/23/1999 | Sold | $99,900$102/sqft |
Source: Public Record Report a problem | ||
Public tax history
| Year | Property taxes | Tax assessment |
|---|---|---|
| 2025 | $4,370 +0.1% | $298,100 +4.2% |
| 2024 | $4,364 +3.1% | $286,000 +7% |
| 2023 | $4,232 -0.5% | $267,200 +12.5% |
| 2022 | $4,253 +12.5% | $237,600 +22.2% |
| 2021 | $3,779 +4.5% | $194,400 +4.7% |
| 2020 | $3,617 +13.5% | $185,700 +20.9% |
| 2018 | $3,187 -1.2% | $153,600 -2% |
| 2017 | $3,225 +3.8% | $156,800 +2% |
| 2016 | $3,106 -2.4% | $153,700 -1.7% |
| 2015 | $3,182 +6.5% | $156,300 +2.7% |
| 2014 | $2,989 +3.5% | $152,200 -2.6% |
| 2013 | $2,887 +11.6% | $156,300 +7.7% |
| 2012 | $2,587 +3.6% | $145,100 -0.4% |
| 2011 | $2,497 +2.2% | $145,700 -9.6% |
| 2010 | $2,444 +3.7% | $161,200 -13.7% |
| 2009 | $2,356 +4.6% | $186,800 -2% |
| 2008 | $2,252 +4% | $190,700 -1.2% |
| 2007 | $2,165 +2.9% | $193,100 +6.9% |
| 2006 | $2,103 +21.4% | $180,700 +20% |
| 2005 | $1,732 +1.7% | $150,600 +4.1% |
| 2004 | $1,703 +8.4% | $144,600 +49.4% |
| 2003 | $1,571 +2.8% | $96,800 |
| 2001 | $1,528 | $96,800 |
Find assessor info on the county website
Monthly payment
Est. payment
Payment breakdown
Explore the cost of this home by adjusting the details. Changes won't be saved.Climate risks
Neighborhood: 01550
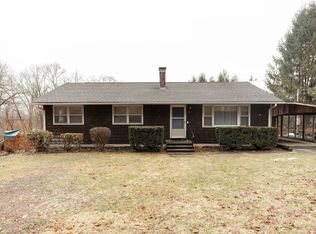
Similar homes
- $349,9004 bd1 ba1k sqft21 Temple Dr, Southbridge, MA 01550For Sale
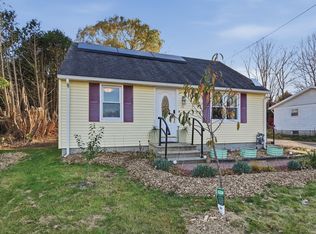 MLS ID #73599263, Amy Bisson, Lamacchia Realty, Inc.. MLS PIN
- $365,0003 bd2 ba1.4k sqft25 Westwood Pkwy, Southbridge, MA 01550For Sale
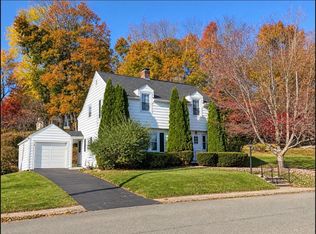 MLS ID #73566070, Dawn Truax, Red Door Realty. MLS PIN
- $350,0003 bd1 ba1.2k sqft19 Fiske Hill Rd, Sturbridge, MA 01566For Sale
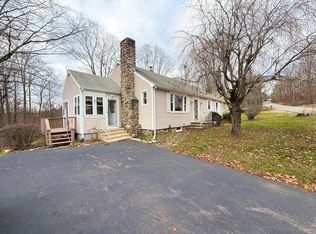 MLS ID #73602531, Noelle Merle, Hometown National Realty Inc.. MLS PIN
- $399,9003 bd2 ba1.1k sqft389 Breakneck Rd, Southbridge, MA 01550For Sale
 MLS ID #73586425, Spiro Thomo, Aucoin Ryan Realty. MLS PIN
- $350,0002 bd1 ba864 sqft30 Hilltop Drive, Woodstock, CT 06282For Sale
 MLS ID #24214889, Lisa M. Therecka, Therecka & Associates LLC. Smart MLS
- $399,9003 bd2 ba1.1k sqft101 Lyon Hill Road, Woodstock, CT 06281For SaleMLS ID #24220064, Jared Meehan, RE/MAX Bell Park Realty. Smart MLS
- $349,9003 bd1 ba1.4k sqft15 Mountain Hill Road, Thompson, CT 06277For SaleMLS ID #24221712, Vivian Kozey, CR Premier Properties. Smart MLS
