Welcome to 4518 Wilshire, an extraordinary investment opportunity and handyman special in charming Mound! Ideal for savvy investors, flippers, or handy buyers looking to build instant equity, this 4-bedroom, 2.5-bathroom home is brimming with potential and just waiting for your personal TLC. The functional layout features a light-filled living area that opens to a wonderful three-season porch overlooking the backyard, while the kitchen comes equipped with stainless steel appliances. Bring your design vision to life and maximize this property's true value. Nestled in a desirable community near Lake Minnetonka, you are just minutes from local parks, scenic lakefront access, daily shopping, and dining. Schedule your tour today to unlock this asset's true potential!
Pending
$274,950
4518 Wilshire Blvd, Mound, MN 55364
4beds
1,804sqft
Single Family
Built in 1976
0.25 Acres Lot
$-- Zestimate®
$152/sqft
$-- HOA
What's special
- 16 days
- 1,790
- 198
Likely to sell faster than
Zillow last checked:
Listing updated:
Listed by:
Robert Salmons 888-216-6364,
Entera Realty LLC
Source: NorthstarMLS as distributed by MLS GRID,MLS#: 7154421
Facts & features
Interior
Bedrooms & bathrooms
- Bedrooms: 4
- Bathrooms: 3
- Full bathrooms: 2
- 1/2 bathrooms: 1
Bedroom
- Level: Main
Bedroom 2
- Level: Main
Bedroom 3
- Level: Main
Bedroom 4
- Level: Basement
Kitchen
- Level: Main
Living room
- Level: Main
Heating
- Forced Air
Cooling
- Central Air
Appliances
- Laundry: Washer Hookup
Features
- Basement: Finished,Partial,Walk-Out Access
- Has fireplace: No
Interior area
- Total structure area: 2,592
- Total interior livable area: 1,804 sqft
- Finished area above ground: 1,296
- Finished area below ground: 508
Property
Parking
- Total spaces: 2
- Parking features: Attached
- Attached garage spaces: 2
Accessibility
- Accessibility features: None
Features
- Levels: One
- Stories: 1
Lot
- Size: 0.25 Acres
- Dimensions: 82 x 120
Details
- Foundation area: 1296
- Parcel number: 1911723310014
- Zoning description: Residential-Single Family
Construction
Type & style
- Home type: SingleFamily
- Property subtype: Single Family
Condition
- New construction: No
- Year built: 1976
Utilities & green energy
- Gas: Natural Gas
- Sewer: City Sewer/Connected
- Water: City Water/Connected
Community & HOA
Community
- Subdivision: Avalon
HOA
- Has HOA: No
Location
- Region: Mound
Financial & listing details
- Price per square foot: $152/sqft
- Tax assessed value: $341,900
- Annual tax amount: $3,391
- Date on market: 10/6/2026
- Cumulative days on market: 17 days
Estimated market value
Not available
Estimated sales range
Not available
Not available
Price history
| Date | Event | Price |
|---|---|---|
| 10/16/2026 | Pending sale | $274,950$152/sqft |
Source:  NorthstarMLS as distributed by MLS GRID #7154421 Report a problem | ||
| 10/6/2026 | Listed for sale | $274,950+79.8%$152/sqft |
Source: NorthstarMLS as distributed by MLS GRID #7154421 Report a problem | ||
| 9/24/2026 | Listing removed | $2,445$1/sqft |
Source: Zillow Rentals Report a problem | ||
| 9/2/2026 | Listed for rent | $2,445+11.2%$1/sqft |
Source: Zillow Rentals Report a problem | ||
| 9/5/2025 | Listing removed | $2,199$1/sqft |
Source: Zillow Rentals Report a problem | ||
| 9/4/2025 | Listed for rent | $2,199-3.1%$1/sqft |
Source: Zillow Rentals Report a problem | ||
| 2/24/2025 | Listing removed | $2,270$1/sqft |
Source: Zillow Rentals Report a problem | ||
| 2/17/2025 | Price change | $2,270-1.1%$1/sqft |
Source: Zillow Rentals Report a problem | ||
| 2/10/2025 | Price change | $2,295-2.1%$1/sqft |
Source: Zillow Rentals Report a problem | ||
| 1/31/2025 | Price change | $2,345-7.1%$1/sqft |
Source: Zillow Rentals Report a problem | ||
| 1/27/2025 | Price change | $2,525-3.8%$1/sqft |
Source: Zillow Rentals Report a problem | ||
| 1/24/2025 | Price change | $2,625-3.7%$1/sqft |
Source: Zillow Rentals Report a problem | ||
| 1/22/2025 | Price change | $2,725-2%$2/sqft |
Source: Zillow Rentals Report a problem | ||
| 1/8/2025 | Price change | $2,780-2.5%$2/sqft |
Source: Zillow Rentals Report a problem | ||
| 1/6/2025 | Listed for rent | $2,850+46.5%$2/sqft |
Source: Zillow Rentals Report a problem | ||
| 7/16/2022 | Listing removed | -- |
Source: Zillow Rental Network Premium Report a problem | ||
| 7/11/2022 | Price change | $1,945-2.8%$1/sqft |
Source: Zillow Rental Network Premium Report a problem | ||
| 7/7/2022 | Price change | $2,000-4.8%$1/sqft |
Source: Zillow Rental Network Premium Report a problem | ||
| 6/10/2022 | Price change | $2,100-11.6%$1/sqft |
Source: Zillow Rental Network Premium Report a problem | ||
| 5/15/2022 | Listed for rent | $2,375+32.3%$1/sqft |
Source: Zillow Rental Network Premium Report a problem | ||
| 8/13/2020 | Listing removed | $1,795$1/sqft |
Source: Zillow Rental Network Premium Report a problem | ||
| 8/10/2020 | Price change | $1,795-2.7%$1/sqft |
Source: Zillow Rental Network Premium Report a problem | ||
| 7/22/2020 | Price change | $1,845-2.6%$1/sqft |
Source: Zillow Rental Network Premium Report a problem | ||
| 6/17/2020 | Price change | $1,895-13.7%$1/sqft |
Source: Zillow Rental Network Premium Report a problem | ||
| 5/8/2020 | Listed for rent | $2,195$1/sqft |
Source: Zillow Rental Network Premium Report a problem | ||
| 9/27/2013 | Sold | $152,910$85/sqft |
Source:  Lake Superior Area Realtors as distributed by MLS GRID #2009985 Report a problem | ||
| 4/22/2013 | Sold | $152,910+63.1%$85/sqft |
Source: Agent Provided Report a problem | ||
| 5/10/1996 | Sold | $93,755$52/sqft |
Source: Public Record Report a problem | ||
Public tax history
| Year | Property taxes | Tax assessment |
|---|---|---|
| 2026 | $3,391 +2.2% | $341,900 +13.4% |
| 2025 | $3,319 +3.3% | $301,400 -0.3% |
| 2024 | $3,213 +9.8% | $302,300 -1.9% |
| 2023 | $2,926 +2.6% | $308,200 +3.8% |
| 2022 | $2,852 +2.1% | $297,000 +22.2% |
| 2021 | $2,792 -3.3% | $243,000 +2.5% |
| 2020 | $2,887 +3.4% | $237,000 +3.9% |
| 2019 | $2,792 -3.3% | $228,000 -0.4% |
| 2018 | $2,887 +9.2% | $229,000 +21.2% |
| 2017 | $2,643 +1.2% | $189,000 +13.9% |
| 2016 | $2,611 +9.7% | $166,000 +3.8% |
| 2015 | $2,381 +18% | $160,000 +23.1% |
| 2014 | $2,018 +14.4% | $130,000 -6.5% |
| 2013 | $1,764 -19.6% | $139,000 -20.6% |
| 2012 | $2,194 +5.2% | $175,000 -4.9% |
| 2011 | $2,085 +6.1% | $184,000 -4.7% |
| 2010 | $1,965 -6.7% | $193,000 -11.1% |
| 2009 | $2,107 -2.4% | $217,000 +4.3% |
| 2006 | $2,157 +1.2% | $208,000 +7.8% |
| 2005 | $2,132 +14.7% | $193,000 +13.9% |
| 2004 | $1,860 +23.2% | $169,500 +27% |
| 2002 | $1,509 -24.6% | $133,500 |
| 2001 | $2,001 | -- |
Find assessor info on the county website
Monthly payment
Est. payment
Payment breakdown
Explore the cost of this home by adjusting the details. Changes won't be saved.Climate risks
Neighborhood: 55364

Similar homes
- $334,9003 bd2 ba1.6k sqft4638 Bedford Rd, Mound, MN 55364For Sale
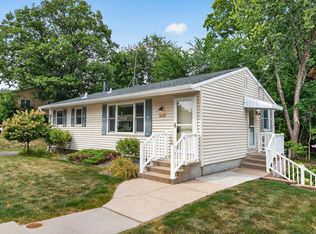
 MLS ID #7136746, Anna Dahlby, Edina Realty, Inc.. NorthstarMLS as distributed by MLS GRID
- $284,9002 bd1 ba1.6k sqft3046 Dundee Ln, Mound, MN 55364For Sale
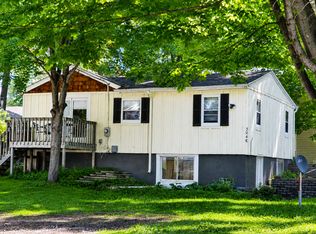 MLS ID #7138639, Nancy F Ferrell Geng, Ferrell Real Estate Group Inc. NorthstarMLS as distributed by MLS GRID
- $365,0003 bd2 ba1.8k sqft5224 Seabury Rd, Mound, MN 55364For Sale
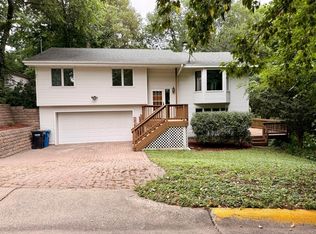 MLS ID #7134173, Jennifer Wulff, Bridge Realty, LLC. NorthstarMLS as distributed by MLS GRID
- $399,0006 bd2 ba2.4k sqft5017-5019 Shoreline Dr, Mound, MN 55364For Sale
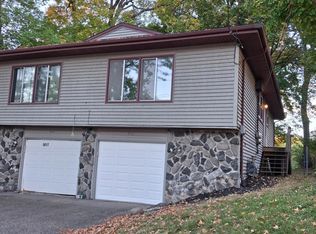 MLS ID #7156572, Kelly L Sowada, 10K Realty. NorthstarMLS as distributed by MLS GRID
- $303,0003 bd2 ba1.8k sqft1515 Bender Rd, Chaska, MN 55318For SaleMLS ID #7142866, Jeremy R Peterson, RE/MAX Results. NorthstarMLS as distributed by MLS GRID
- $389,0003 bd2 ba1.4k sqft5530 Wedgewood Dr, Shorewood, MN 55331For SaleMLS ID #7158838, Joshua Hukriede, Excelsior Realty. NorthstarMLS as distributed by MLS GRID
- $289,9005 bd2 ba2.1k sqft3913 52nd Ave N, Brooklyn Center, MN 55429For SaleMLS ID #7154042, Melissa Zuniga, eXp Realty. NorthstarMLS as distributed by MLS GRID
- $310,0003 bd2 ba1.4k sqft15393 Trillium Cir, Eden Prairie, MN 55344For SaleMLS ID #7155666, Amber N Broadway, Opendoor Brokerage, LLC. NorthstarMLS as distributed by MLS GRID
- $259,9004 bd1 ba1.5k sqft2628 Abbott Ave N, Robbinsdale, MN 55422For SaleMLS ID #7160778, JoAnn White, Ashworth Real Estate. NorthstarMLS as distributed by MLS GRID
- $269,9004 bd2 ba1.9k sqft4601 Oliver Ave N, Minneapolis, MN 55412For SaleMLS ID #7141252, Stacy Churchill, Fuze Real Estate. NorthstarMLS as distributed by MLS GRID
- $385,0004 bd2 ba2.2k sqft1122 Prairie Ct S, Shakopee, MN 55379For SaleMLS ID #7162279, Amber N Broadway, Opendoor Brokerage, LLC. NorthstarMLS as distributed by MLS GRID
- $259,9002 bd3 ba1.7k sqft4731 Spring Cir, Minnetonka, MN 55345For SaleMLS ID #7152774, Darren D Kahmeyer, Bridge Realty, LLC. NorthstarMLS as distributed by MLS GRID
- $345,0004 bd2 ba1.7k sqft5512 Woodside Rd SE, Prior Lake, MN 55372For SaleMLS ID #7160908, Amber Haddy, Kris Lindahl Real Estate. NorthstarMLS as distributed by MLS GRID
- $240,0004 bd2 ba1.3k sqft2102 Lyndale Ave N, Minneapolis, MN 55411For SaleMLS ID #7154704, Trevor Howat, eXp Realty. NorthstarMLS as distributed by MLS GRID
- $399,9004 bd2 ba1.8k sqft17604 Lorence Way, Eden Prairie, MN 55346For SaleMLS ID #7160476, Lee J Arntz, RE/MAX Results. NorthstarMLS as distributed by MLS GRID
- $275,0003 bd2 ba1.2k sqft2762 McNair Dr, Robbinsdale, MN 55422For SaleMLS ID #7133424, Pat Hiller, RE/MAX Results. NorthstarMLS as distributed by MLS GRID
- $320,0003 bd2 ba1.4k sqft15391 Trillium Cir, Eden Prairie, MN 55344For SaleMLS ID #7154558, Amber N Broadway, Opendoor Brokerage, LLC. NorthstarMLS as distributed by MLS GRID
- $240,0002 bd2 ba1.2k sqft10501 Cedar Lake Rd APT 512, Minnetonka, MN 55305For SaleMLS ID #7149556, Mari Koplin, Verve Realty. NorthstarMLS as distributed by MLS GRID
- $315,0002 bd2 ba1.2k sqft1283 Creekside Dr, Waconia, MN 55387For SaleMLS ID #7158351, Kevin Warkentien, Bridge Realty, LLC. NorthstarMLS as distributed by MLS GRID
- $315,0002 bd2 ba1k sqft8223 Brunswick Cir N, Brooklyn Park, MN 55443For SaleMLS ID #7161793, Svitlana Moore, Chasing Dreams Real Estate. NorthstarMLS as distributed by MLS GRID
