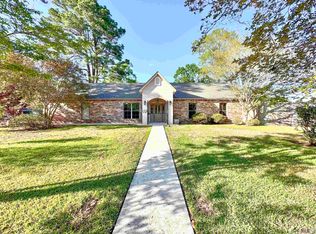
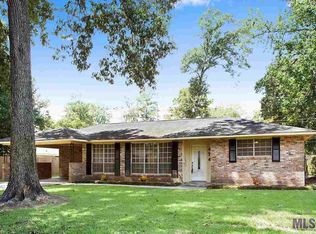
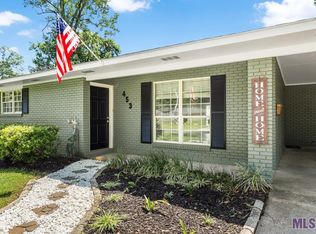
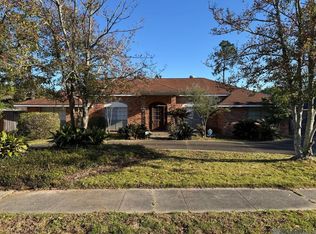
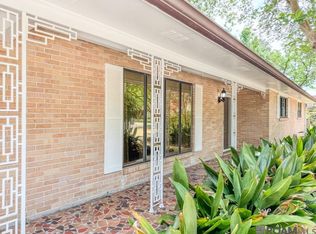
Very large home is in a suburban neighborhood convenient to the employment centers of downtown Baton Rouge features spaceous attached carport
Active
$255,000
477 Nassau Dr, Baton Rouge, LA 70815
5beds
3,134sqft
Single Family Residence
Built in 1970
0.27 Acres Lot
$247,900 Zestimate®
$81/sqft
$-- HOA
What's special
- 22 days |
- 385 |
- 20 |
Zillow last checked:
Listing updated:
Listed by:
Robert White 504-897-2445,
Rob White Realty, LLC 757-220-1967
Source: GSREIN,MLS#: 2561914
Loading...
Facts & features
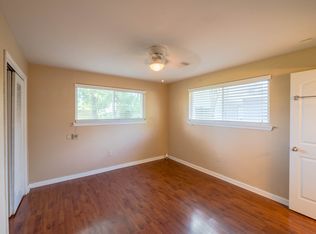
Interior
Bedrooms & bathrooms
- Bedrooms: 5
- Bathrooms: 3
- Full bathrooms: 3
Bedroom
- Level: Lower
- Dimensions: 16X12
Bedroom
- Level: Lower
- Dimensions: 11X11
Bedroom
- Level: Lower
- Dimensions: 11X11
Bedroom
- Level: Lower
- Dimensions: 11X11
Bedroom
- Level: Lower
- Dimensions: 11X11
Dining room
- Level: Lower
- Dimensions: 11.5X14.5
Living room
- Level: Lower
- Dimensions: 12x20
Heating
- Other
Cooling
- Other
Features
- Has fireplace: Yes
- Fireplace features: Wood Burning
Interior area
- Total structure area: 3,147
- Total interior livable area: 3,134 sqft
Property
Parking
- Parking features: Carport
- Has carport: Yes
Features
- Levels: One and One Half
- Stories: 1.5
Lot
- Size: 0.27 Acres
- Dimensions: 145 x 82
- Features: City Lot, Rectangular Lot
Details
- Parcel number: 00940917
- Special conditions: Real Estate Owned
Construction
Type & style
- Home type: SingleFamily
- Architectural style: Contemporary
- Property subtype: Single Family Residence
Materials
- Brick
- Foundation: Slab
- Roof: Asphalt
Condition
- Average Condition
- Year built: 1970
Utilities & green energy
- Sewer: Public Sewer
- Water: None
- Utilities for property: Water Not Available
Community & HOA
HOA
- Has HOA: No
Location
- Region: Baton Rouge
Financial & listing details
- Price per square foot: $81/sqft
- Tax assessed value: $299,300
- Annual tax amount: $2,959
- Date on market: 6/8/2026
Foreclosure details
Estimated market value
$247,900
$236,000 - $260,000
$2,647/mo
Price history
| Date | Event | Price |
|---|---|---|
| 3/18/2026 | Sold | -- |
Source: Public Record Report a problem | ||
| 9/5/2023 | Listing removed | -- |
Source: | ||
| 8/19/2023 | Pending sale | $295,000$94/sqft |
Source: | ||
| 7/14/2023 | Listed for sale | $295,000-4.9%$94/sqft |
Source: | ||
| 6/9/2022 | Sold | -- |
Source: | ||
| 4/24/2022 | Pending sale | $310,250$99/sqft |
Source: | ||
| 4/5/2022 | Listed for sale | $310,250-4.5%$99/sqft |
Source: | ||
| 3/31/2022 | Listing removed | -- |
Source: | ||
| 2/17/2022 | Price change | $325,000-1.2%$104/sqft |
Source: | ||
| 2/10/2022 | Listed for sale | $329,000+40.1%$105/sqft |
Source: | ||
| 5/8/2021 | Listing removed | -- |
Source: Zillow Rental Manager Report a problem | ||
| 4/27/2021 | Listed for rent | $2,400+77.8%$1/sqft |
Source: Zillow Rental Manager Report a problem | ||
| 1/24/2019 | Sold | -- |
Source: | ||
| 12/17/2018 | Price change | $234,900-4.1%$75/sqft |
Source: Keller Williams Realty Red Stick Partners #2018018829 Report a problem | ||
| 11/13/2018 | Price change | $244,900-2%$78/sqft |
Source: Keller Williams Realty Red Stick Partners #2018018829 Report a problem | ||
| 9/26/2018 | Listed for sale | $249,900+194.3%$80/sqft |
Source: Ruston Properties #2018016270 Report a problem | ||
| 5/2/2018 | Sold | -- |
Source: Public Record Report a problem | ||
| 3/21/2018 | Price change | $84,900-17.5%$27/sqft |
Source: Ruston Properties #2016014643 Report a problem | ||
| 1/2/2018 | Price change | $102,900-14.2%$33/sqft |
Source: Ruston Properties #2016014643 Report a problem | ||
| 8/15/2017 | Listed for sale | $119,900$38/sqft |
Source: Ruston Properties #2016014643 Report a problem | ||
| 5/31/2014 | Listing removed | $1,350 |
Source: Owner Report a problem | ||
| 5/13/2014 | Listed for rent | $1,350 |
Source: Owner Report a problem | ||
| 6/6/2003 | Sold | -- |
Source: Public Record Report a problem | ||
Public tax history
| Year | Property taxes | Tax assessment |
|---|---|---|
| 2025 | $2,959 +6% | $29,930 |
| 2024 | $2,792 -1.8% | $29,930 |
| 2023 | $2,842 +30% | $29,930 +22.8% |
| 2022 | $2,185 +2.2% | $24,380 |
| 2021 | $2,139 -1.6% | $24,380 |
| 2020 | $2,173 +36.8% | $24,380 +99% |
| 2019 | $1,588 +1.2% | $12,250 |
| 2018 | $1,570 +108.9% | $12,250 |
| 2017 | $751 | $12,250 +41.4% |
| 2016 | $751 +142.2% | $8,663 -29.3% |
| 2015 | $310 -58% | $12,250 |
| 2014 | $738 | $12,250 |
| 2013 | $738 -49.3% | $12,250 |
| 2012 | $1,456 +51.8% | $12,250 +40% |
| 2011 | $959 +0% | $8,750 |
| 2010 | $959 +303.5% | $8,750 |
| 2009 | $238 -2.2% | $8,750 |
| 2007 | $243 +331.5% | $8,750 +29.6% |
| 2000 | $56 | $6,750 |
Find assessor info on the county website
Monthly payment
Estimated monthly payment$1,822
All calculations are estimates and provided by Zillow, Inc. for informational purposes only. Actual amounts may vary.
HOA fees may include property taxes on listings classified as Co-Ops. Contact the listing agent and/or owner for fee details.
Mortgage interest rates are dependent on a number of factors, including credit score, down payment, and repayment length. Interest rate data provided by Zillow Group Marketplace, Inc. as of 1/1/1970 from various mortgage lenders with which we have lead or other similar arrangements; the Estimated Payment is an average of those rates.
See how much you could borrow to make a competitive offer.
Climate risks
Neighborhood: Sherwood Forest
Nearby schools
GreatSchools rating
- 8/10Twin Oaks Elementary SchoolGrades: PK-5Distance: 0.8 mi
- 4/10Southeast Middle SchoolGrades: 6-8Distance: 2.5 mi
- 2/10Broadmoor Senior High SchoolGrades: 9-12Distance: 1.8 mi
A local agent can set up tours, give advice and negotiate with sellers.
A local lender can help you make sure your offer is ready when you are.


Nearby cities
Nearby neighborhoods
Nearby zip codes
Other Baton Rouge Topics
