$--
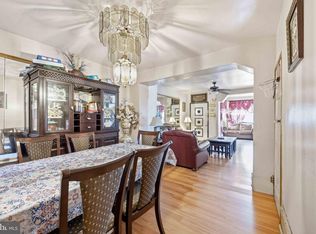
2 bd1 ba-- sqft
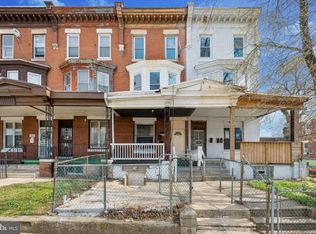
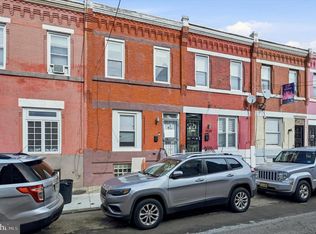
4914 N 12th St #BASEMENT, Philadelphia, PA 19141
Off Market
Likely to sell faster than
Zillow last checked:
Listing updated:
Alex Lam 267-307-6347,
EXIT Elevate Realty (215) 623-6000

$261,900
$249,000 - $275,000
$1,604/mo
| Date | Event | Price |
|---|---|---|
| 5/26/2025 | Listing removed | $295,000$146/sqft |
Source:  Bright MLS #PAPH2443140 Report a problem | ||
| 2/21/2025 | Listed for sale | $295,000+11.3%$146/sqft |
Source: Bright MLS #PAPH2443140 Report a problem | ||
| 8/18/2022 | Listing removed | $265,000$131/sqft |
Source: Bright MLS #PAPH2085520 Report a problem | ||
| 2/19/2022 | Listed for sale | $265,000$131/sqft |
Source: Bright MLS #PAPH2085520 Report a problem | ||
| 12/19/2021 | Listing removed | $265,000$131/sqft |
Source: Bright MLS #PAPH2039294 Report a problem | ||
| 11/2/2021 | Listed for sale | $265,000+51.4%$131/sqft |
Source: Bright MLS #PAPH2039294 Report a problem | ||
| 10/21/2019 | Listing removed | $175,000$86/sqft |
Source: Keller Williams Philadelphia #PAPH836482 Report a problem | ||
| 9/24/2019 | Listed for sale | $175,000+4.8%$86/sqft |
Source: Keller Williams Philadelphia #PAPH836482 Report a problem | ||
| 1/17/2019 | Listing removed | $167,000$82/sqft |
Source: Keller Williams Philadelphia #PAPH103792 Report a problem | ||
| 1/14/2019 | Price change | $167,000+7.7%$82/sqft |
Source: Keller Williams Philadelphia #PAPH103792 Report a problem | ||
| 12/4/2018 | Price change | $155,000-8.8%$77/sqft |
Source: Keller Williams Philadelphia #PAPH103792 Report a problem | ||
| 11/11/2018 | Listed for sale | $169,900+17.2%$84/sqft |
Source: Keller Williams Philadelphia #PAPH103792 Report a problem | ||
| 4/25/2006 | Sold | $145,000+480%$72/sqft |
Source: Public Record Report a problem | ||
| 2/11/2003 | Sold | $25,000$12/sqft |
Source: Public Record Report a problem | ||
| Year | Property taxes | Tax assessment |
|---|---|---|
| 2025 | $2,695 +21.1% | $192,500 +21.1% |
| 2024 | $2,224 | $158,900 |
| 2023 | $2,224 +41.6% | $158,900 |
| 2022 | $1,571 | -- |
| 2021 | $1,571 +0.4% | -- |
| 2018 | $1,564 | -- |
| 2017 | $1,564 -3% | -- |
| 2016 | $1,611 | -- |
| 2015 | $1,611 | -- |
| 2014 | $1,611 +4.5% | $115,100 +1979.1% |
| 2012 | $1,542 | $5,536 |
| 2011 | -- | $5,536 |
| 2010 | -- | $5,536 |
| 2009 | -- | $5,536 |
| 2008 | -- | $5,536 |
| 2007 | -- | $5,536 +7.5% |
| 2006 | -- | $5,152 |
| 2005 | -- | $5,152 |
| 2004 | -- | $5,152 |
| 2003 | -- | $5,152 -28.1% |
| 2002 | -- | $7,168 |
| 2000 | -- | $7,168 |
| 1999 | -- | $7,168 |
Source: Bright MLS. This data may not be complete. We recommend contacting the local school district to confirm school assignments for this home.
A local agent can set up tours, give advice and negotiate with sellers.