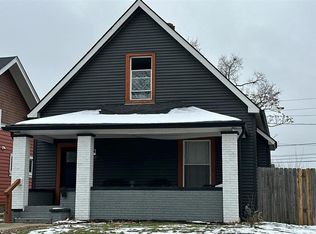
This 2283 square foot single family home has 4 bedrooms and 1.0 bathrooms. This home is located at 501 Saint Paul St, Indianapolis, IN 46203.
Foreclosed
Est. $190,600
501 Saint Paul St, Indianapolis, IN 46203
4beds
2,283sqft
SingleFamily
Built in 1900
4,356 Square Feet Lot
$190,600 Zestimate®
$83/sqft
$-- HOA
Overview
- 84 days
- 47
- 2
Facts & features
Interior
Bedrooms & bathrooms
- Bedrooms: 4
- Bathrooms: 1
- Full bathrooms: 1
Heating
- Other
Cooling
- Central
Appliances
- Included: Range / Oven, Refrigerator
Features
- Flooring: Hardwood
- Basement: Unfinished
- Has fireplace: Yes
Interior area
- Total interior livable area: 2,283 sqft
Property
Parking
- Total spaces: 1
- Parking features: Off-street
Features
- Exterior features: Vinyl
Lot
- Size: 4,356 Square Feet
Details
- Parcel number: 491007157005000101
Construction
Type & style
- Home type: SingleFamily
- Architectural style: TraditonalAmerican
Materials
- Frame
- Foundation: Crawl/Raised
- Roof: Asphalt
Condition
- Year built: 1900
Community & HOA
Location
- Region: Indianapolis
Financial & listing details
- Price per square foot: $83/sqft
- Tax assessed value: $259,000
- Annual tax amount: $5,396
Foreclosure details
Estimated market value
$190,600
$168,000 - $210,000
$1,950/mo
Price history
| Date | Event | Price |
|---|---|---|
| 7/30/2026 | Sold | $178,400-24.1%$78/sqft |
Source: Public Record Report a problem | ||
| 3/24/2025 | Listing removed | $235,000$103/sqft |
Source:  MIBOR as distributed by MLS GRID #22003086 Report a problem | ||
| 9/26/2024 | Listed for sale | $235,000+14.6%$103/sqft |
Source: MIBOR as distributed by MLS GRID #22003086 Report a problem | ||
| 6/26/2023 | Listing removed | -- |
Source: MIBOR as distributed by MLS GRID #21911682 Report a problem | ||
| 5/16/2023 | Pending sale | $205,000$90/sqft |
Source: MIBOR as distributed by MLS GRID #21911682 Report a problem | ||
| 5/15/2023 | Price change | $205,000+2.6%$90/sqft |
Source: MIBOR as distributed by MLS GRID #21911682 Report a problem | ||
| 5/12/2023 | Listed for sale | $199,900-13.1%$88/sqft |
Source: MIBOR as distributed by MLS GRID #21911682 Report a problem | ||
| 8/18/2022 | Listing removed | -- |
Source: MIBOR as distributed by MLS GRID #21866304 Report a problem | ||
| 7/13/2022 | Price change | $230,000-7.6%$101/sqft |
Source: MIBOR as distributed by MLS GRID #21866304 Report a problem | ||
| 6/30/2022 | Price change | $249,000-4.2%$109/sqft |
Source: MIBOR as distributed by MLS GRID #21866304 Report a problem | ||
| 6/27/2022 | Listed for sale | $259,900+36.8%$114/sqft |
Source: MIBOR as distributed by MLS GRID #21866304 Report a problem | ||
| 3/22/2021 | Sold | $190,000+5.6%$83/sqft |
Source: MIBOR as distributed by MLS GRID #21764385 Report a problem | ||
| 2/22/2021 | Pending sale | $179,900$79/sqft |
Source: MIBOR as distributed by MLS GRID #21764385 Report a problem | ||
| 2/11/2021 | Listed for sale | $179,900+343.1%$79/sqft |
Source: MIBOR as distributed by MLS GRID #21764385 Report a problem | ||
| 3/17/2020 | Sold | $40,600-24.8%$18/sqft |
Source: Public Record Report a problem | ||
| 2/4/2020 | Pending sale | $53,999$24/sqft |
Source: United, REALTORS� #21676461 Report a problem | ||
| 1/10/2020 | Listed for sale | $53,999$24/sqft |
Source: United, REALTORS� #21676461 Report a problem | ||
| 12/5/2019 | Pending sale | $53,999$24/sqft |
Source: United, REALTORS� #21676461 Report a problem | ||
| 11/13/2019 | Price change | $53,999-1.8%$24/sqft |
Source: United, REALTORS� #21676461 Report a problem | ||
| 10/22/2019 | Listed for sale | $55,000+96.4%$24/sqft |
Source: United, REALTORS� #21676461 Report a problem | ||
| 6/20/2018 | Sold | $28,000-9.7%$12/sqft |
Source: MIBOR as distributed by MLS GRID #21556466 Report a problem | ||
| 6/20/2018 | Pending sale | $31,000$14/sqft |
Source: Wynkoop Brokerage Firm, LLC #21556466 Report a problem | ||
| 6/11/2018 | Price change | $31,000-4.6%$14/sqft |
Source: Wynkoop Brokerage Firm, LLC #21556466 Report a problem | ||
| 6/5/2018 | Price change | $32,500-4.4%$14/sqft |
Source: Wynkoop Brokerage Firm, LLC #21556466 Report a problem | ||
| 5/24/2018 | Price change | $34,000-2.9%$15/sqft |
Source: Wynkoop Brokerage Firm, LLC #21556466 Report a problem | ||
| 5/9/2018 | Listed for sale | $35,000$15/sqft |
Source: Wynkoop Brokerage Firm, LLC #21556466 Report a problem | ||
| 4/11/2018 | Pending sale | $35,000$15/sqft |
Source: Wynkoop Brokerage Firm, LLC #21556466 Report a problem | ||
| 4/6/2018 | Listed for sale | $35,000+348.7%$15/sqft |
Source: Wynkoop Brokerage Firm, LLC #21556466 Report a problem | ||
| 2/13/2018 | Sold | $7,800-67.5%$3/sqft |
Source: Public Record Report a problem | ||
| 6/11/2014 | Sold | $24,000$11/sqft |
Source: Public Record Report a problem | ||
Public tax history
| Year | Property taxes | Tax assessment |
|---|---|---|
| 2025 | $5,396 +122.1% | $259,000 +13.9% |
| 2024 | $2,430 +5.5% | $227,400 +9.6% |
| 2023 | $2,304 +610.4% | $207,400 +5.8% |
| 2022 | $324 -70% | $196,000 +260.3% |
| 2021 | $1,079 +18.1% | $54,400 +16.7% |
| 2020 | $914 +9.6% | $46,600 +20.4% |
| 2019 | $834 -27.4% | $38,700 -28.2% |
| 2018 | $1,149 +0.8% | $53,900 +2.5% |
| 2017 | $1,139 +49.5% | $52,600 +1.3% |
| 2016 | $762 +1.3% | $51,900 +49.1% |
| 2014 | $752 -10.8% | $34,800 +4.2% |
| 2013 | $843 | $33,400 -11.2% |
| 2012 | $843 | $37,600 -6.9% |
| 2011 | -- | $40,400 |
| 2010 | $840 -2.5% | $40,400 |
| 2009 | $861 | $40,400 -13.5% |
| 2007 | -- | $46,700 |
Find assessor info on the county website
Monthly payment
Climate risks
Neighborhood: Christian Park
Nearby schools
Schools provided by the listing agent
- District: Indianapolis Public Schools
Source: The MLS. This data may not be complete. We recommend contacting the local school district to confirm school assignments for this home.

Similar homes
- $200,0005 bd1 ba2.5k sqft1432 Hoyt Ave, Indianapolis, IN 46203For Sale
 NextHome
- $179,9003 bd2 ba1.7k sqft1530 Barth Ave, Indianapolis, IN 46203Active
 MLS ID #22129478, Simona Baskin, Compass Indiana, LLC. MIBOR as distributed by MLS GRID
- $175,0004 bd3 ba2.3k sqft5940 Laurel Street, Indianapolis, IN 46227For Sale
 MLS ID #2026012707, Andrew Wolf, eXp Realty, LLC. SIRA
- $--4 bd2 ba1.7k sqft1036 N Lasalle St, Indianapolis, IN 46201Auction
 ServiceLink Auction
