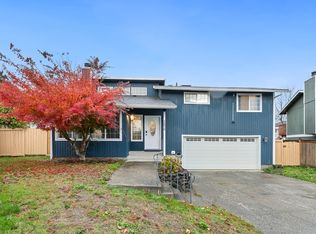
Rare investment opportunity in a prime South Tacoma neighborhood, offering strong upside potential for savvy investors or an owner-occupant ready to build sweat equity! This up-and-down duplex features one unit on the main level and a second unit upstairs, sitting on a generous lot with a large, fully fenced backyard and convenient alley access. While the property is a fixer in need of renovation, its solid footprint and unbeatable location make it well worth a look. Situated just minutes from local schools, parks, shopping, dining, and major commuter routes, this is your chance to reimagine a multi-family asset in a high-demand rental area and maximize its future value. Bring your vision and contractor—opportunities like this in South Tacoma don't last long!
Active
Listed by: Best Choice Realty • Jodi Van Allman • 253-381-5001
$450,000
5402 S J Street, Tacoma, WA 98408
6beds
2baths
2,112sqft
Duplex, Multi Family
Built in 1910
-- sqft lot
$437,000 Zestimate®
$213/sqft
$-- HOA
What's special
Large fully fenced backyardSecond unit upstairsGenerous lotConvenient alley access
- --
- on Zillow
- 4
- views
- 0
- saves
Zillow last checked:
Listing updated:
Listed by:
Jodi Van Allman 253-381-5001 jodivrealestate@gmail.com,
Best Choice Realty
Source: NWMLS as distributed by MLS GRID,MLS#: 2603859
Facts & features
Interior
Bedrooms & bathrooms
- Bedrooms: 6
- Bathrooms: 2
Heating
- Baseboard, Electric
Cooling
- None
Features
- Flooring: Vinyl, Carpet
- Has fireplace: No
Interior area
- Total structure area: 2,112
- Total interior livable area: 2,112 sqft
Property
Lot
- Size: 4,325 Square Feet
- Features: Curbs, Paved, Sidewalk, Fenced-Fully
Details
- Parcel number: 7785006210
- Zoning description: Residential,Jurisdiction: City
- Special conditions: Standard
Construction
Type & style
- Home type: MultiFamily
- Architectural style: Duplex
- Property subtype: Duplex, Multi Family
Materials
- Wood Siding
- Foundation: Poured Concrete
- Roof: Composition
Condition
- Year built: 1910
- Major remodel year: 1983
Utilities & green energy
- Electric: Company: TPU
- Sewer: Sewer Connected, Company: TPU
- Water: Public, Company: TPU
Community & HOA
Community
- Subdivision: South Tacoma
Location
- Region: Tacoma
Financial & listing details
- Price per square foot: $213/sqft
- Tax assessed value: $435,300
- Annual tax amount: $4,746
- Date on market: 11/14/2026
- Listing terms: Conventional
Estimated market value
$437,000
$398,000 - $472,000
$2,091/mo
Price history
| Date | Event | Price |
|---|---|---|
| 11/14/2026 | Listed for sale | $450,000+45.2%$213/sqft |
Source:  NWMLS as distributed by MLS GRID #2603859 Report a problem | ||
| 6/28/2025 | Listing removed | $1,600$1/sqft |
Source: Zillow Rentals Report a problem | ||
| 6/11/2025 | Listed for rent | $1,600$1/sqft |
Source: Zillow Rentals Report a problem | ||
| 9/13/2022 | Listing removed | -- |
Source: Zillow Rental Manager Report a problem | ||
| 8/13/2022 | Listed for rent | $1,600$1/sqft |
Source: Zillow Rental Manager Report a problem | ||
| 5/8/2018 | Sold | $310,000$147/sqft |
Source: NWMLS as distributed by MLS GRID #1264843 Report a problem | ||
| 5/8/2018 | Listed for sale | $310,000$147/sqft |
Source: RE/MAX Northwest Realtors #1264843 Report a problem | ||
| 4/8/2018 | Pending sale | $310,000$147/sqft |
Source: RE/MAX Northwest Realtors #1264843 Report a problem | ||
| 4/4/2018 | Listed for sale | $310,000+226.3%$147/sqft |
Source: RE/MAX Northwest Realtors #1264843 Report a problem | ||
| 7/2/2009 | Sold | $95,000-44.1%$45/sqft |
Source: NWMLS as distributed by MLS GRID #28148368 Report a problem | ||
| 12/28/2008 | Listing removed | $169,900$80/sqft |
Source: Postlets #28148368 Report a problem | ||
| 12/12/2008 | Price change | $169,900-8.1%$80/sqft |
Source: Postlets #28148368 Report a problem | ||
| 10/26/2008 | Price change | $184,900-2.6%$88/sqft |
Source: Postlets #28148368 Report a problem | ||
| 10/6/2008 | Price change | $189,900-2.6%$90/sqft |
Source: Postlets #28148368 Report a problem | ||
| 9/23/2008 | Price change | $194,900-2.5%$92/sqft |
Source: Postlets #28148368 Report a problem | ||
| 9/9/2008 | Listed for sale | $199,900-1.1%$95/sqft |
Source: Postlets #28148368 Report a problem | ||
| 8/21/2008 | Sold | $202,107-4.7%$96/sqft |
Source: Public Record Report a problem | ||
| 1/25/2006 | Sold | $212,000+11.3%$100/sqft |
Source: NWMLS as distributed by MLS GRID #25148943 Report a problem | ||
| 6/22/2005 | Sold | $190,500+124.1%$90/sqft |
Source: Public Record Report a problem | ||
| 3/8/2004 | Sold | $85,000-15%$40/sqft |
Source: NWMLS as distributed by MLS GRID #23146923 Report a problem | ||
| 9/30/2003 | Sold | $100,000+45.1%$47/sqft |
Source: Public Record Report a problem | ||
| 12/3/1999 | Sold | $68,900+3%$33/sqft |
Source: Public Record Report a problem | ||
| 8/15/1997 | Sold | $66,895$32/sqft |
Source: Public Record Report a problem | ||
Public tax history
| Year | Property taxes | Tax assessment |
|---|---|---|
| 2025 | $4,746 +2.1% | $435,300 +2% |
| 2024 | $4,648 +3.6% | $426,800 +6% |
| 2023 | $4,486 +3% | $402,800 -3.9% |
| 2022 | $4,355 +7.6% | $419,200 +18.8% |
| 2021 | $4,049 +31.2% | $352,900 +28.2% |
| 2019 | $3,085 -1.2% | $275,300 +16.1% |
| 2018 | $3,124 +17% | $237,200 +20% |
| 2017 | $2,670 +13% | $197,600 +37.7% |
| 2016 | $2,363 | $143,500 +5.7% |
| 2014 | $2,363 +14.3% | $135,800 +8.3% |
| 2013 | $2,068 | $125,400 +6.5% |
| 2012 | -- | $117,700 -15% |
| 2011 | -- | $138,500 -7% |
| 2010 | -- | $148,900 -10.5% |
| 2009 | -- | $166,400 -4.7% |
| 2008 | $2,262 | $174,600 -9.6% |
| 2007 | $2,262 +49.2% | $193,200 +116.3% |
| 2002 | $1,516 +18.6% | $89,300 +0.9% |
| 2001 | $1,278 | $88,500 |
Find assessor info on the county website
Monthly payment
Est. payment
Payment breakdown
Explore the cost of this home by adjusting the details. Changes won't be saved.Climate risks
Neighborhood: South End


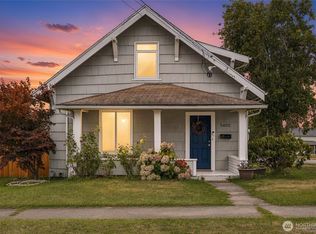
Similar homes
- $440,0003 bd1 ba1.3k sqftElsmere, Tacoma, WA 98408Active
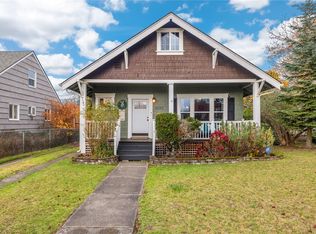 MLS ID #2602020, Darlene Heseltine. NWMLS as distributed by MLS GRID
- $499,0003 bd2 ba1.3k sqft4834 S Park Avenue, Tacoma, WA 98408Active
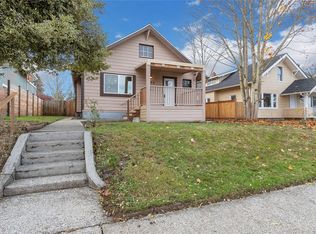 MLS ID #2603596, Elisa Pierce. NWMLS as distributed by MLS GRID
- $--5 bd2 ba1.7k sqft7810 S K St, Tacoma, WA 98408Auction
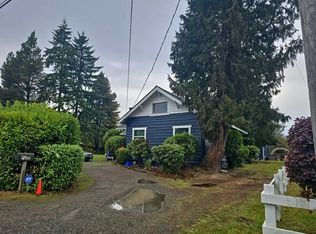 Auction.com 2
- $449,9503 bd2 ba1.2k sqft1678 S 60th Street, Tacoma, WA 98408Active
 MLS ID #2602513, John Doan. NWMLS as distributed by MLS GRID
