This 1124 square foot single family home has 2 bedrooms and 1.0 bathrooms. This home is located at 544 Nixon Ave, Reno, NV 89509.
Pre-foreclosure
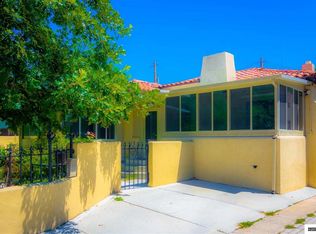
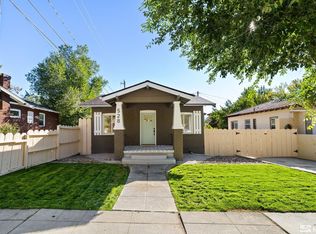
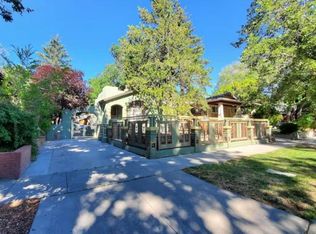
Street View
Est. $601,400
544 Nixon Ave, Reno, NV 89509
2beds
1,124sqft
SingleFamily
Built in 1929
5,706 Square Feet Lot
$601,400 Zestimate®
$535/sqft
$-- HOA
Overview
- 50 days |
- 30 |
- 1 |
Facts & features
Interior
Bedrooms & bathrooms
- Bedrooms: 2
- Bathrooms: 1
- Full bathrooms: 1
Heating
- Forced air, Gas
Appliances
- Included: Dishwasher, Dryer, Garbage disposal, Microwave, Range / Oven, Refrigerator, Washer
Features
- Flooring: Tile, Hardwood
- Basement: Partially finished
- Has fireplace: Yes
Interior area
- Total interior livable area: 1,124 sqft
Property
Parking
- Parking features: Garage - Detached
Features
- Exterior features: Stucco
- Has view: Yes
- View description: City, Mountain
Lot
- Size: 5,706 Square Feet
Details
- Parcel number: 01120315
Construction
Type & style
- Home type: SingleFamily
Materials
- Frame
- Roof: Tile
Condition
- Year built: 1929
Community & HOA
Location
- Region: Reno
Financial & listing details
- Price per square foot: $535/sqft
- Tax assessed value: $271,521
- Annual tax amount: $1,374
Visit our professional directory to find a foreclosure specialist in your area that can help with your home search.
Find a foreclosure agentForeclosure details
Estimated market value
$601,400
$535,000 - $668,000
$2,652/mo
Price history
Price history is unavailable.
Public tax history
| Year | Property taxes | Tax assessment |
|---|---|---|
| 2026 | $1,374 +3% | $95,032 +0.8% |
| 2025 | $1,334 +3% | $94,292 +7.5% |
| 2024 | $1,296 +3% | $87,678 +5.8% |
| 2023 | $1,258 +2.6% | $82,901 +20.1% |
| 2022 | $1,226 +3.1% | $69,022 +10.5% |
| 2021 | $1,189 +3% | $62,454 +3.9% |
| 2020 | $1,155 -2.9% | $60,124 |
| 2019 | $1,189 +3% | $60,124 +10.6% |
| 2018 | $1,155 +8.9% | $54,378 +0.5% |
| 2017 | $1,061 | $54,122 +0.3% |
| 2016 | $1,061 | $53,950 +45.9% |
| 2015 | $1,061 +3.1% | $36,982 +15% |
| 2014 | $1,029 | $32,164 +18.9% |
| 2013 | $1,029 | $27,052 |
| 2012 | -- | $27,052 -8.8% |
| 2011 | -- | $29,648 -25.1% |
| 2010 | -- | $39,584 -3.1% |
| 2009 | -- | $40,845 -25.8% |
| 2008 | -- | $55,065 |
| 2007 | -- | $55,065 +19.8% |
| 2006 | -- | $45,979 +2.8% |
| 2005 | -- | $44,726 +58.1% |
| 2004 | -- | $28,289 -0.5% |
| 2003 | -- | $28,432 +0.3% |
| 2002 | -- | $28,344 |
| 2001 | -- | $28,344 |
Find assessor info on the county website
Monthly payment
Estimated monthly payment$1,822
All calculations are estimates and provided by Zillow, Inc. for informational purposes only. Actual amounts may vary.
HOA fees may include property taxes on listings classified as Co-Ops. Contact the listing agent and/or owner for fee details.
Mortgage interest rates are dependent on a number of factors, including credit score, down payment, and repayment length. Interest rate data provided by Zillow Group Marketplace, Inc. as of 1/1/1970 from various mortgage lenders with which we have lead or other similar arrangements; the Estimated Payment is an average of those rates.
See how much you could borrow to make a competitive offer.
Climate risks
Neighborhood: Old Southwest
Nearby schools
GreatSchools rating
- 9/10Jessie Beck Elementary SchoolGrades: PK-5Distance: 1 mi
- 6/10Darrell C Swope Middle SchoolGrades: 6-8Distance: 1.6 mi
- 7/10Reno High SchoolGrades: 9-12Distance: 0.6 mi


- Nevada
- Washoe County
- Reno
- 89509
- Old Southwest
- 544 Nixon Ave
Nearby cities
Nearby neighborhoods
Nearby zip codes
Other Reno Topics
