$321,100
3 bd|2 ba|1.1k sqft
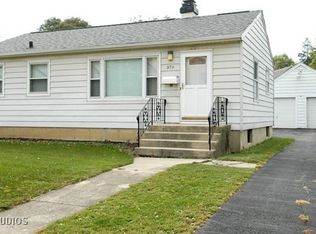
564 N Crystal Ave, Elgin, IL 60123
Off Market
Zillow last checked:
Val Laborevitch 847-830-1129,
Realhome Services & Solutions, Inc.
Not available
Estimated sales range
Not available
Not available
| Date | Event | Price |
|---|---|---|
| 12/5/2025 | Contingent | $338,900$147/sqft |
Source: | ||
| 12/2/2025 | Price change | $338,900-0.3%$147/sqft |
Source: | ||
| 10/8/2025 | Price change | $339,900-1.4%$147/sqft |
Source: | ||
| 9/27/2025 | Listed for sale | $344,900$150/sqft |
Source: | ||
| 9/17/2025 | Contingent | $344,900$150/sqft |
Source: | ||
| 8/27/2025 | Price change | $344,900-1.4%$150/sqft |
Source: | ||
| 7/31/2025 | Price change | $349,900-2.8%$152/sqft |
Source: | ||
| 7/17/2025 | Listed for sale | $359,900-2.7%$156/sqft |
Source: | ||
| 7/8/2025 | Contingent | $369,900$160/sqft |
Source: | ||
| 7/1/2025 | Price change | $369,900-1.4%$160/sqft |
Source: | ||
| 6/12/2025 | Listed for sale | $375,000+25%$163/sqft |
Source: | ||
| 5/19/2023 | Sold | $300,000+0.3%$130/sqft |
Source: | ||
| 4/7/2023 | Pending sale | $299,000$130/sqft |
Source: | ||
| 3/26/2023 | Contingent | $299,000$130/sqft |
Source: | ||
| 3/20/2023 | Price change | $299,000-4.8%$130/sqft |
Source: | ||
| 3/10/2023 | Listed for sale | $314,000$136/sqft |
Source: | ||
| 3/6/2023 | Contingent | $314,000$136/sqft |
Source: | ||
| 2/18/2023 | Listed for sale | $314,000+58.6%$136/sqft |
Source: | ||
| 7/10/2017 | Sold | $198,000-4.7%$86/sqft |
Source: | ||
| 5/29/2017 | Pending sale | $207,800$90/sqft |
Source: Baird & Warner #09580988 Report a problem | ||
| 5/28/2017 | Price change | $207,8000%$90/sqft |
Source: Baird & Warner #09580988 Report a problem | ||
| 5/21/2017 | Price change | $207,9000%$90/sqft |
Source: Baird & Warner #09580988 Report a problem | ||
| 5/11/2017 | Price change | $208,000-0.5%$90/sqft |
Source: Baird & Warner #09580988 Report a problem | ||
| 4/29/2017 | Price change | $209,000-4.6%$91/sqft |
Source: Baird & Warner #09580988 Report a problem | ||
| 4/13/2017 | Price change | $219,000-4.4%$95/sqft |
Source: Baird & Warner #09580988 Report a problem | ||
| 3/31/2017 | Listed for sale | $229,000+31.6%$99/sqft |
Source: Baird & Warner #09580988 Report a problem | ||
| 12/3/2010 | Listing removed | $174,000-0.6%$75/sqft |
Source: Baird & Warner - Fox Valley #07536085 Report a problem | ||
| 11/15/2010 | Sold | $175,000+2.9%$76/sqft |
Source: Baird & Warnerc #07536085_60123 Report a problem | ||
| 12/22/1999 | Sold | $170,000$74/sqft |
Source: Public Record Report a problem | ||
| Year | Property taxes | Tax assessment |
|---|---|---|
| 2024 | $6,628 +5% | $90,816 +10.7% |
| 2023 | $6,312 +5.8% | $82,046 +9.7% |
| 2022 | $5,967 +4.6% | $74,812 +7% |
| 2021 | $5,705 +2.9% | $69,944 +4.7% |
| 2020 | $5,543 +3% | $66,773 +5% |
| 2019 | $5,380 +5.4% | $63,605 +10.3% |
| 2018 | $5,106 -8.9% | $57,643 +5.8% |
| 2017 | $5,605 +4% | $54,494 +7.8% |
| 2016 | $5,392 | $50,555 +9.1% |
| 2015 | -- | $46,338 +1.2% |
| 2014 | -- | $45,766 -10.2% |
| 2013 | -- | $50,966 -7.4% |
| 2012 | -- | $55,051 -10.7% |
| 2011 | -- | $61,626 -9.7% |
| 2010 | -- | $68,209 -6.7% |
| 2009 | -- | $73,123 |
| 2008 | -- | $73,123 +3.3% |
| 2007 | -- | $70,774 +4.2% |
| 2006 | -- | $67,928 +6.5% |
| 2005 | -- | $63,788 +6.8% |
| 2004 | -- | $59,749 +7.8% |
| 2003 | -- | $55,431 +8% |
| 2002 | -- | $51,325 +7.5% |
| 2001 | -- | $47,766 +5.1% |
| 2000 | -- | $45,457 |
Find assessor info on the county website
Source: MRED as distributed by MLS GRID. This data may not be complete. We recommend contacting the local school district to confirm school assignments for this home.
A local agent can set up tours, give advice and negotiate with sellers.
A local lender can help you make sure your offer is ready when you are.