This 1488 square foot single family home has 3 bedrooms and 2.0 bathrooms. This home is located at 5612 Wo Griffin Rd, Plant City, FL 33567.
Pre-foreclosure
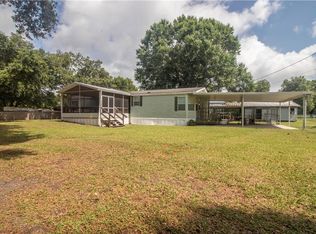
Street View
Est. $449,000
5612 Wo Griffin Rd, Plant City, FL 33567
3beds
2baths
1,488sqft
SingleFamily
Built in 1986
2.55 Acres Lot
$449,000 Zestimate®
$302/sqft
$-- HOA
Overview
- 118 days |
- 7 |
- 1 |
Facts & features
Interior
Bedrooms & bathrooms
- Bedrooms: 3
- Bathrooms: 2
Heating
- Other
Cooling
- Central
Features
- Flooring: Tile, Other, Carpet, Concrete, Hardwood, Linoleum / Vinyl
- Has fireplace: Yes
Interior area
- Total interior livable area: 1,488 sqft
Property
Parking
- Parking features: Carport, Garage
Features
- Exterior features: Other, Stucco
Lot
- Size: 2.55 Acres
Details
- Parcel number: 212914ZZZ000004028300U
Construction
Type & style
- Home type: SingleFamily
Materials
- masonry
- Roof: Composition
Condition
- Year built: 1986
Community & HOA
Location
- Region: Plant City
Financial & listing details
- Price per square foot: $302/sqft
- Tax assessed value: $362,898
- Annual tax amount: $3,798
Visit our professional directory to find a foreclosure specialist in your area that can help with your home search.
Find a foreclosure agentForeclosure details
Estimated market value
$449,000
$400,000 - $494,000
$2,186/mo
Price history
| Date | Event | Price |
|---|---|---|
| 6/14/2002 | Sold | $154,000$103/sqft |
Source: Public Record Report a problem | ||
Public tax history
| Year | Property taxes | Tax assessment |
|---|---|---|
| 2025 | $3,798 +8.5% | $186,675 +2.9% |
| 2024 | $3,501 +5% | $181,414 +3% |
| 2023 | $3,336 +8.1% | $176,130 +3% |
| 2022 | $3,086 +1.3% | $171,000 +3% |
| 2021 | $3,046 +5.2% | $166,019 +1.4% |
| 2020 | $2,896 +9.8% | $163,727 +6.1% |
| 2019 | $2,638 | $154,253 +1.9% |
| 2018 | $2,638 +3.9% | $151,377 -14.6% |
| 2017 | $2,539 +1.5% | $177,165 +22% |
| 2016 | $2,501 +1.4% | $145,214 +0.7% |
| 2015 | $2,466 +0% | $144,205 +0.8% |
| 2014 | $2,465 | $143,061 +0.9% |
| 2013 | $2,465 -0.5% | $141,761 +1.7% |
| 2012 | $2,478 -7.2% | $139,391 -6.3% |
| 2011 | $2,671 -20.7% | $148,693 -8.9% |
| 2010 | $3,370 +20% | $163,134 -2.8% |
| 2009 | $2,809 +0.1% | $167,861 +0.1% |
| 2008 | $2,805 -5.5% | $167,693 +3% |
| 2007 | $2,969 -2% | $162,809 +5.5% |
| 2006 | $3,028 +0.2% | $154,297 +3% |
| 2005 | $3,023 | $149,803 +3% |
| 2004 | -- | $145,440 +1.9% |
| 2003 | -- | $142,728 +42.2% |
| 2002 | -- | $100,373 +1.6% |
| 2001 | -- | $98,792 -15.6% |
| 2000 | $1,863 | $117,007 |
Find assessor info on the county website
Monthly payment
Estimated monthly payment$1,822
All calculations are estimates and provided by Zillow, Inc. for informational purposes only. Actual amounts may vary.
HOA fees may include property taxes on listings classified as Co-Ops. Contact the listing agent and/or owner for fee details.
Mortgage interest rates are dependent on a number of factors, including credit score, down payment, and repayment length. Interest rate data provided by Zillow Group Marketplace, Inc. as of 1/1/1970 from various mortgage lenders with which we have lead or other similar arrangements; the Estimated Payment is an average of those rates.
See how much you could borrow to make a competitive offer.
Climate risks
Neighborhood: 33567
Nearby schools
GreatSchools rating
- 7/10Robinson Elementary SchoolGrades: PK-5Distance: 0.9 mi
- 2/10Turkey Creek Middle SchoolGrades: 6-8Distance: 1.1 mi
- 4/10Durant High SchoolGrades: 9-12Distance: 4.9 mi


- Florida
- Hillsborough County
- Plant City
- 33567
- 5612 Wo Griffin Rd
Nearby cities
Nearby zip codes
Other Plant City Topics
