This 1418 square foot single family home has 3 bedrooms and 2.0 bathrooms. This home is located at 6548 Outlook Dr, Citrus Heights, CA 95621.
Pre-foreclosure
Est. $441,200
6548 Outlook Dr, Citrus Heights, CA 95621
3beds
2baths
1,418sqft
SingleFamily
Built in 1960
6,534 Square Feet Lot
$441,200 Zestimate®
$311/sqft
$-- HOA
Overview
- 35 days
- 23
- 0
Facts & features
Interior
Bedrooms & bathrooms
- Bedrooms: 3
- Bathrooms: 2
Heating
- Other
Cooling
- Central
Interior area
- Total interior livable area: 1,418 sqft
Property
Parking
- Parking features: Garage - Attached
Lot
- Size: 6,534 Square Feet
Details
- Parcel number: 20901330020000
Construction
Type & style
- Home type: SingleFamily
Materials
- wood frame
- Roof: Composition
Condition
- Year built: 1960
Community & HOA
Location
- Region: Citrus Heights
Financial & listing details
- Price per square foot: $311/sqft
- Tax assessed value: $232,596
Foreclosure details
Estimated market value
$441,200
$410,000 - $468,000
$2,520/mo
Price history
| Date | Event | Price |
|---|---|---|
| 11/8/2010 | Sold | $178,000+48.2%$126/sqft |
Source: MetroList Services of CA #10078217 Report a problem | ||
| 7/30/2010 | Sold | $120,100-49.7%$85/sqft |
Source: Public Record Report a problem | ||
| 12/23/2003 | Sold | $239,000$169/sqft |
Source: Public Record Report a problem | ||
Public tax history
| Year | Property taxes | Tax assessment |
|---|---|---|
| 2026 | -- | $232,596 +2% |
| 2025 | $4,784 +5% | $228,037 +2% |
| 2024 | $4,556 +5.7% | $223,566 +2% |
| 2023 | $4,309 +6.3% | $219,183 +2% |
| 2022 | $4,053 +7% | $214,886 +2% |
| 2021 | $3,787 +22.9% | $210,673 +1% |
| 2020 | $3,081 -21.1% | $208,514 +2% |
| 2019 | $3,904 +10.2% | $204,426 +2% |
| 2018 | $3,542 +23.4% | $200,418 +2% |
| 2017 | $2,870 -10.6% | $196,489 +2% |
| 2016 | $3,212 +4.7% | $192,638 +1.5% |
| 2015 | $3,067 | $189,746 +2% |
| 2014 | $3,067 | $186,031 +0.5% |
| 2013 | -- | $185,191 +10.7% |
| 2012 | -- | $167,320 -6% |
| 2011 | -- | $178,000 -3.6% |
| 2010 | -- | $184,709 -28.6% |
| 2008 | -- | $258,698 +2% |
| 2007 | -- | $253,626 +2% |
| 2006 | -- | $248,654 +2% |
| 2005 | -- | $243,780 +2% |
| 2004 | -- | $239,000 +102.3% |
| 2003 | -- | $118,115 +5.9% |
| 2002 | -- | $111,500 +4.8% |
| 2001 | -- | $106,373 +2% |
| 2000 | -- | $104,288 |
Find assessor info on the county website
Monthly payment
Climate risks
Neighborhood: Northwest
- $421,9003 bd1 ba1.1k sqft6542 Outlook Dr, Citrus Heights, CA 95621Off Market
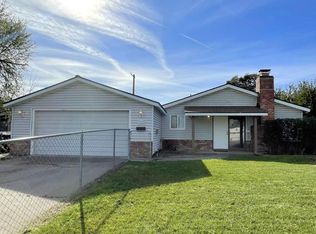
- $412,3003 bd2 ba1.1k sqft6437 Briartree Way, Citrus Heights, CA 95621Off Market
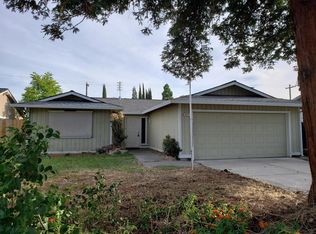
- $414,1003 bd2 ba1.2k sqft6536 Outlook Dr, Citrus Heights, CA 95621Off Market
- $443,0003 bd2 ba1.1k sqft6441 Briartree Way, Citrus Heights, CA 95621Off Market
