FRESH, CLEAN & READY! Beautiful SE Salem home with a great layout! Many special features including a covered front porch/entry, vaulted great room, dining area with slider to patio & fenced backyard! Primary bedroom with ensuite. Many updates including recent roof & hybrid water heater, new LVP, new carpet in the bedrooms, new lighting & fixtures, new doors & trim, new electric garage door, new microwave, updated appliances, indoor utility, new screens, fenced backyard with patio & garden beds, plus room for an RV! (Just add your own gate). Schools are Four Corners. Houck & South Salem High. Call today! Listing broker is co-owner.
Pre-foreclosure
Est. $400,100
702 Buster Ln SE, Salem, OR 97317
3beds
2baths
1,334sqft
Single Family Residence
Built in 1998
7,405 Square Feet Lot
$400,100 Zestimate®
$300/sqft
$-- HOA
Overview
- 16 days
- 28
- 0
Zillow last checked:
Source: HomeSmart,MLS#: 23433808
Facts & features
Interior
Bedrooms & bathrooms
- Bedrooms: 3
- Bathrooms: 2
Heating
- Other
Features
- Has fireplace: No
Interior area
- Total structure area: 1,334
- Total interior livable area: 1,334 sqft
Property
Parking
- Total spaces: 2
- Parking features: Driveway, OffStreet, 2 Space(s)
Lot
- Size: 7,405 Square Feet
Details
- Parcel number: 555146
Construction
Type & style
- Home type: SingleFamily
- Property subtype: Single Family Residence
Materials
- Roof: Composition
Condition
- Year built: 1998
Community & HOA
Location
- Region: Salem
Financial & listing details
- Price per square foot: $300/sqft
- Tax assessed value: $369,140
- Annual tax amount: $3,270
- Date on market: 9/14/2023
- Lease term: Contact For Details
Foreclosure details
Estimated market value
$400,100
$380,000 - $420,000
$2,288/mo
Price history
| Date | Event | Price |
|---|---|---|
| 10/13/2023 | Sold | $391,000+1.6%$293/sqft |
Source:  RMLS (OR) #23433808 Report a problem | ||
| 9/19/2023 | Pending sale | $384,900$289/sqft |
Source:  HomeSmart #23433808 Report a problem | ||
| 9/19/2023 | Contingent | $384,900$289/sqft |
Source:  WVMLS #808918 Report a problem | ||
| 9/18/2023 | Pending sale | $384,900$289/sqft |
Source: RMLS (OR) #23433808 Report a problem | ||
| 9/9/2023 | Price change | $384,900-1.3%$289/sqft |
Source: RMLS (OR) #23433808 Report a problem | ||
| 9/2/2023 | Price change | $389,900-2.5%$292/sqft |
Source: RMLS (OR) #23433808 Report a problem | ||
| 8/27/2023 | Listed for sale | $399,900+6.5%$300/sqft |
Source: RMLS (OR) #23433808 Report a problem | ||
| 1/3/2023 | Listing removed | -- |
Source: WVMLS #798187 Report a problem | ||
| 9/29/2022 | Price change | $375,500-2.6%$281/sqft |
Source: WVMLS #798187 Report a problem | ||
| 9/23/2022 | Listed for sale | $385,500$289/sqft |
Source: WVMLS #798187 Report a problem | ||
Public tax history
| Year | Property taxes | Tax assessment |
|---|---|---|
| 2025 | $3,270 +3.2% | $198,960 +3% |
| 2024 | $3,167 -9.6% | $193,170 +6.1% |
| 2023 | $3,503 | $182,090 |
| 2022 | -- | $182,090 +3% |
| 2021 | $3,908 +12.4% | $176,790 +6.1% |
| 2020 | $3,476 +27.1% | $166,660 |
| 2019 | $2,734 +1.9% | -- |
| 2018 | $2,683 | -- |
| 2017 | $2,683 +22.1% | -- |
| 2016 | $2,197 | -- |
| 2015 | $2,197 +10.9% | -- |
| 2014 | $1,981 +10.6% | -- |
| 2013 | $1,792 | -- |
| 2012 | $1,792 -6.9% | -- |
| 2011 | $1,925 +1.9% | $139,600 +6.1% |
| 2010 | $1,889 +0.8% | $131,600 |
| 2009 | $1,874 -0.1% | $131,600 +3% |
| 2008 | $1,875 +3.9% | $127,770 |
| 2007 | $1,805 +2.2% | -- |
| 2006 | $1,766 +1.8% | -- |
| 2005 | $1,734 -0.6% | -- |
| 2004 | $1,744 +5.7% | -- |
| 2003 | $1,651 +2.8% | -- |
| 2002 | $1,607 +2.3% | -- |
| 2001 | $1,571 +3.8% | -- |
| 2000 | $1,514 | -- |
Find assessor info on the county website
Monthly payment
Climate risks
Neighborhood: Four Corners


Similar homes
- $405,0003 bd2 ba1.2k sqft4314 Munkers St SE, Salem, OR 97317For Sale
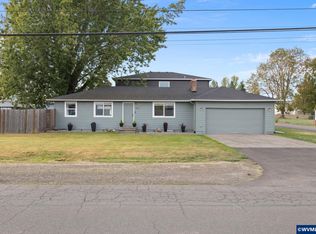
 MLS ID #846195, JOEL GANDER, Gander Property Group. WVMLS
- $424,9003 bd2 ba1.3k sqft2477 Exmoor Ct SE, Salem, OR 97317For Sale
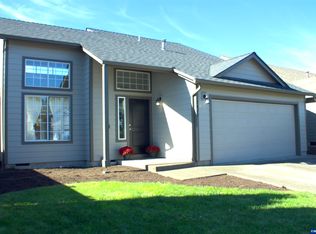 MLS ID #846709, DAVID GONZALEZ, Sundance Realty Llc. WVMLS
- $399,9004 bd2 ba1.3k sqft4915 Wagon Rim Ct SE, Salem, OR 97317For Sale
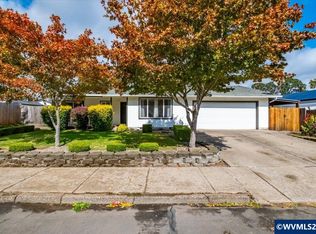 MLS ID #846377, SHERRI GREGORY, Keller Williams Realty-Ght. WVMLS
- $420,0003 bd2 ba1.2k sqft4656 Cherrybud Ct SE, Salem, OR 97317For Sale
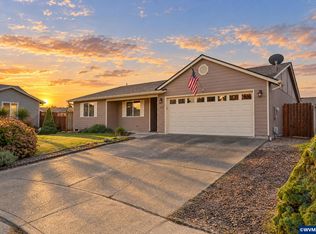 MLS ID #846125, DANIEL GANDEE, Real Broker. WVMLS
- $345,0003 bd2 ba1k sqft349 Duch Ln SE, Salem, OR 97317For SaleMLS ID #845256, ARIELLE HERNANDEZ, Sundance Realty Llc. WVMLS
- $360,0003 bd2 ba1.2k sqft348 Duch Ln SE, Salem, OR 97317For SaleMLS ID #845255, ARIELLE HERNANDEZ, Sundance Realty Llc. WVMLS
- $360,0003 bd2 ba1.1k sqft358 Duch Ln SE, Salem, OR 97317For SaleMLS ID #845257, ARIELLE HERNANDEZ, Sundance Realty Llc. WVMLS
- $394,9003 bd2 ba1k sqft386 40th Pl SE, Salem, OR 97317For SaleMLS ID #840794, PEGGY BEAN, Realty One Group Willamette Valley. WVMLS
- $449,0003 bd3 ba1.8k sqft987 Munkers Ct SE, Salem, OR 97317For SaleMLS ID #845896, ROSS MARTINSON, Paramount Real Estate Services. WVMLS
- $355,0003 bd2 ba1.2k sqft359 Duch Ln SE, Salem, OR 97317For SaleMLS ID #845258, ARIELLE HERNANDEZ, Sundance Realty Llc. WVMLS
- $410,0003 bd2 ba1.3k sqft1662 Cherry Bark Ct SE, Salem, OR 97317For SaleMLS ID #841499, FRANCISCO GARCIA, Coldwell Banker Mountain West Real Estate, Inc.. WVMLS
- $369,0003 bd2 ba1.2k sqft4527 Garden Ct SE, Salem, OR 97317For SaleMLS ID #845768, JAIME HUDSON, Premiere Property Group, Llc Albany. WVMLS
- $379,9003 bd2 ba1.4k sqft568 49th Ave SE, Salem, OR 97317For SaleMLS ID #843610, NOELLE PHILLIPS, Jmg Jason Mitchell Group-Albany. WVMLS
- $390,0003 bd2 ba1.3k sqft435 Buckboard Ct SE, Salem, OR 97317For SaleMLS ID #841326, EDEL LOPEZ, Realty Of America, Llc. WVMLS
- $415,0003 bd2 ba1.1k sqft1742 Raywanda Ct NE, Salem, OR 97301For SaleMLS ID #846718, ROBERT EDWARDSEN, Real Broker. WVMLS
- $399,0004 bd2 ba1.7k sqft4965 Arrowood Ct SE, Salem, OR 97317For SaleMLS ID #843633, STEPHANIE WELLS, Real Broker. WVMLS
- $365,9003 bd2 ba1.1k sqft4222 Donalyn St NE, Salem, OR 97301For SaleMLS ID #846283, LEANNA & TREVOR SMITH, Exp Realty, Llc. WVMLS
- $349,9003 bd2 ba1.1k sqft4678 La Vista Way SE, Salem, OR 97317For SaleMLS ID #843963, MARK SHADRIN, Berkshire Hathaway Homeservices R E Prof. WVMLS
- $423,0003 bd3 ba1.6k sqft4844 Milo Ave NE, Salem, OR 97301For SaleMLS ID #846738, DIANA ROJAS, Realty One Group Willamette Valley. WVMLS
- $349,9003 bd2 ba1.2k sqft4722 Swegle Rd NE, Salem, OR 97301For SaleMLS ID #846539, SHERRY KRUSE, Premiere Property Group, Llc Albany. WVMLS
