Solid 3-family property situated on a side street close to downtown. The building consists of two first floor 1-bedroom/studio units and the second floor is a 4 room, 2- bedroom unit which in currently vacant and ideal for an owner occupant. The rent quoted for the 2nd floor unit is the current market rent. This property is ideal for an owner occupant or investor and is situated on a 41,000+ sq. ft. lot with frontage on Studleys pond. All separate heat and utilities. This one checks all the boxes.
For sale
Price cut: $30K (10/28)
$749,000
78 Prospect St, Rockland, MA 02370
4beds
1,428sqft
3 Family
Built in 1900
-- sqft lot
$735,900 Zestimate®
$525/sqft
$-- HOA
What's special
Frontage on studleys pond
- 32 days
- 352
- 15
Zillow last checked:
Listing updated:
Listed by:
Tom McFarland 617-851-0900,
RE/MAX Realty Pros 617-328-3200
Source: MLS PIN,MLS#: 73589254
Facts & features
Interior
Bedrooms & bathrooms
- Bedrooms: 4
- Bathrooms: 3
- Full bathrooms: 3
Features
- Basement: Full,Unfinished
- Number of fireplaces: 1
Interior area
- Total structure area: 1,428
- Total interior livable area: 1,428 sqft
- Finished area above ground: 1,428
Property
Parking
- Total spaces: 6
- Parking features: Off Street
- Uncovered spaces: 6
Features
- On waterfront: Yes
- Waterfront features: Waterfront, Pond
Lot
- Size: 0.96 Acres
- Features: Level
Details
- Parcel number: M:0051 B:0000 L:00520,1158168
- Zoning: RESIDE
Construction
Type & style
- Home type: MultiFamily
- Property subtype: 3 Family
Materials
- Frame
- Foundation: Brick/Mortar
- Roof: Shingle
Condition
- Year built: 1900
Utilities & green energy
- Electric: Circuit Breakers
- Sewer: Public Sewer
- Water: Public
Community & HOA
Community
- Features: Public Transportation, Shopping, Park, Walk/Jog Trails, Medical Facility
Location
- Region: Rockland
Financial & listing details
- Price per square foot: $525/sqft
- Tax assessed value: $586,800
- Annual tax amount: $8,139
- Date on market: 10/10/2026
- Total actual rent: 4750
Estimated market value
$735,900
$699,000 - $773,000
$2,926/mo
Price history
| Date | Event | Price |
|---|---|---|
| 10/28/2026 | Price change | $749,000-3.9%$525/sqft |
Source: MLS PIN #73589254 Report a problem | ||
| 10/10/2026 | Listed for sale | $779,000+101.8%$546/sqft |
Source: MLS PIN #73589254 Report a problem | ||
| 11/16/2017 | Sold | $386,000+1.6%$270/sqft |
Source: Public Record Report a problem | ||
| 10/2/2017 | Pending sale | $379,900$266/sqft |
Source: Germaine Realty Group, Inc. #72233914 Report a problem | ||
| 9/26/2017 | Listed for sale | $379,900+8.6%$266/sqft |
Source: Germaine Realty Group, Inc. #72233914 Report a problem | ||
| 3/3/2016 | Listing removed | $850$1/sqft |
Source: iHOUSEweb, Inc. #71956008 Report a problem | ||
| 2/5/2016 | Listed for rent | $850-32%$1/sqft |
Source: iHOUSEweb, Inc. #71956008 Report a problem | ||
| 8/3/2015 | Listing removed | $1,250$1/sqft |
Source: iHOUSEweb, Inc. #71872630 Report a problem | ||
| 7/15/2015 | Listed for rent | $1,250$1/sqft |
Source: iHOUSEweb, Inc. #71872630 Report a problem | ||
| 2/23/2010 | Listing removed | $349,900$245/sqft |
Source: Robert Ahern #71012295 Report a problem | ||
| 12/23/2009 | Listed for sale | $349,900+25%$245/sqft |
Source: Robert Ahern #71012295 Report a problem | ||
| 12/9/2002 | Sold | $280,000$196/sqft |
Source: Public Record Report a problem | ||
Public tax history
| Year | Property taxes | Tax assessment |
|---|---|---|
| 2025 | $7,502 +3% | $548,800 +5.9% |
| 2024 | $7,283 +0.6% | $518,000 +8.9% |
| 2023 | $7,240 +4.3% | $475,700 +14.8% |
| 2022 | $6,940 -0.1% | $414,300 +3.1% |
| 2021 | $6,945 +3.6% | $401,900 +4.9% |
| 2020 | $6,703 +4.5% | $383,000 +7% |
| 2019 | $6,415 +9.6% | $358,000 +11.4% |
| 2018 | $5,854 +2.1% | $321,300 +3.5% |
| 2017 | $5,734 +3.9% | $310,300 +3.9% |
| 2016 | $5,521 +1.1% | $298,600 +4.1% |
| 2015 | $5,460 +5.8% | $286,900 +2% |
| 2014 | $5,161 +4.3% | $281,400 |
| 2013 | $4,947 +7.7% | $281,400 -3.1% |
| 2012 | $4,593 +5.3% | $290,500 -1% |
| 2011 | $4,363 +7.7% | $293,400 +4.2% |
| 2010 | $4,052 +13.9% | $281,600 -15.3% |
| 2009 | $3,556 -2.5% | $332,300 -4.3% |
| 2008 | $3,647 +1.4% | $347,300 -5.5% |
| 2007 | $3,595 +0.6% | $367,600 |
| 2006 | $3,573 +1.6% | $367,600 +19.9% |
| 2005 | $3,518 +4.1% | $306,700 +20.6% |
| 2004 | $3,380 +1.9% | $254,300 |
| 2003 | $3,316 +15.9% | $254,300 +58.6% |
| 2002 | $2,860 +13.4% | $160,300 +13% |
| 1999 | $2,522 | $141,900 |
Find assessor info on the county website
Monthly payment
Est. payment
Payment breakdown
Explore the cost of this home by adjusting the details. Changes won't be saved.Climate risks
Neighborhood: 02370

Similar homes
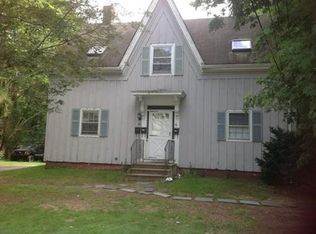
- $--3 bd2 ba1.6k sqft79 Exchange St, Rockland, MA 02370Auction
 Auction.com 2
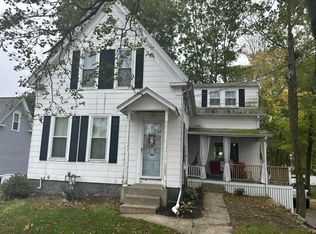
- $674,9004 bd2 ba1.6k sqft480 Forest St, Rockland, MA 02370For Sale
 MLS ID #73594028, Brenna Crowe, Real Broker MA, LLC. MLS PIN
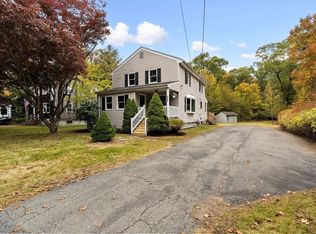
- $849,0004 bd3 ba1.9k sqft231-233 Vernon St, Rockland, MA 02370For Sale
 MLS ID #73596131, Mina Shenouda, Keller Williams South Watuppa. MLS PIN
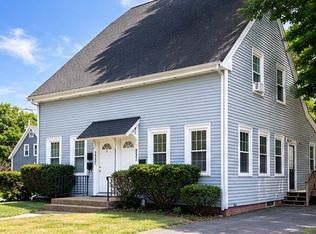
- $785,0003 bd2 ba1.7k sqft404 Concord St, Rockland, MA 02370For Sale By Owner

