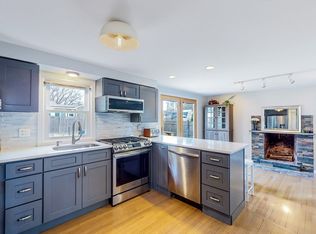
Must See !!!! This Unique 3 bedroom 1 bathroom home is minutes from the beach. Opportunity to live in a beautiful home close to Brant Rock Beach. This charming cape consists of hardwood floors throughout, a renovated kitchen with stainless steel appliances and granite countertops. A beautiful bonus sun room with cathedral ceilings is directly off the kitchen. Yard includes 2 spacious sheds and an outdoor shower with hot and cold water. Two paved driveways!!! This home brings warmth and is a great for entertaining especially after a nice relaxing day at the beach. Plenty of Local shops and restaurants to enjoy year round.
Pending
$469,000
78 Tower Ave, Marshfield, MA 02050
3beds
1,214sqft
Single Family Residence
Built in 1953
4,791 Square Feet Lot
$594,100 Zestimate®
$386/sqft
$-- HOA
What's special
- 86 days
- 45
- 2
Zillow last checked:
Listing updated:
Listed by:
Thomas Noto 617-590-4615,
RE/MAX Realty Plus 617-268-5100,
Thomas Noto 617-590-4615
Source: MLS PIN,MLS#: 72865942
Facts & features
Interior
Bedrooms & bathrooms
- Bedrooms: 3
- Bathrooms: 1
- Full bathrooms: 1
Living room
- Level: First
Heating
- Central
Cooling
- Central Air
Appliances
- Included: Gas Water Heater
Features
- Has basement: No
- Has fireplace: No
Interior area
- Total structure area: 1,214
- Total interior livable area: 1,214 sqft
Property
Parking
- Total spaces: 2
- Parking features: Paved Drive
- Uncovered spaces: 2
Features
- Waterfront features: 1/10 to 3/10 To Beach
Lot
- Size: 4,791 Square Feet
Details
- Parcel number: 1078474
- Zoning: 9999999
Construction
Type & style
- Home type: SingleFamily
- Architectural style: Cape
- Property subtype: Single Family Residence
Materials
- Foundation: Slab
Condition
- Year built: 1953
Utilities & green energy
- Sewer: Public Sewer
- Water: Public
Community & HOA
HOA
- Has HOA: No
Location
- Region: Marshfield
Financial & listing details
- Price per square foot: $386/sqft
- Tax assessed value: $509,000
- Annual tax amount: $4,300
- Date on market: 8/14/2026
Estimated market value
$594,100
$564,000 - $630,000
$2,647/mo
Price history
| Date | Event | Price |
|---|---|---|
| 9/23/2026 | Pending sale | $469,000$386/sqft |
Source: MLS PIN #72865942 Report a problem | ||
| 6/3/2022 | Listing removed | -- |
Source: MLS PIN #72865942 Report a problem | ||
| 9/13/2021 | Price change | $469,000-6%$386/sqft |
Source: MLS PIN #72865942 Report a problem | ||
| 9/2/2021 | Listed for sale | $499,000-3.1%$411/sqft |
Source: MLS PIN #72865942 Report a problem | ||
| 7/26/2021 | Listing removed | $515,000$424/sqft |
Source: MLS PIN #72865942 Report a problem | ||
| 7/15/2021 | Listed for sale | $515,000+24.1%$424/sqft |
Source: MLS PIN #72865942 Report a problem | ||
| 3/12/2020 | Sold | $415,000-3.5%$342/sqft |
Source: Public Record Report a problem | ||
| 2/19/2020 | Pending sale | $429,900$354/sqft |
Source: Molisse Realty Group #72603310 Report a problem | ||
| 1/1/2020 | Listed for sale | $429,900+36.5%$354/sqft |
Source: Molisse Realty Group #72603310 Report a problem | ||
| 7/26/2005 | Sold | $315,000$259/sqft |
Source: Public Record Report a problem | ||
Public tax history
| Year | Property taxes | Tax assessment |
|---|---|---|
| 2025 | $5,156 +1.4% | $520,800 +6.4% |
| 2024 | $5,084 +3.7% | $489,300 +13% |
| 2023 | $4,903 +3% | $433,100 +17.9% |
| 2022 | $4,758 +5.4% | $367,400 +7.4% |
| 2021 | $4,514 +10.3% | $342,200 +11.5% |
| 2020 | $4,091 +2.2% | $306,900 +2.6% |
| 2019 | $4,002 +2% | $299,100 +1.9% |
| 2018 | $3,925 +6.6% | $293,600 +9.4% |
| 2017 | $3,682 +4.5% | $268,400 +5.7% |
| 2016 | $3,524 +4.5% | $253,900 +0% |
| 2015 | $3,373 +2.1% | $253,800 +2.1% |
| 2014 | $3,305 +8.8% | $248,700 |
| 2013 | $3,037 +3.5% | $248,700 -0.3% |
| 2012 | $2,934 +7.9% | $249,500 +3.6% |
| 2011 | $2,720 +1.9% | $240,900 -3% |
| 2010 | $2,670 +1.3% | $248,400 -5.9% |
| 2009 | $2,637 +6.6% | $264,000 -6.9% |
| 2008 | $2,473 +11.7% | $283,600 +4.3% |
| 2007 | $2,214 +5.3% | $272,000 +7.6% |
| 2006 | $2,102 +5.9% | $252,900 +23.7% |
| 2004 | $1,985 +6.6% | $204,400 +23.7% |
| 2003 | $1,862 +2.4% | $165,200 +15.4% |
| 2002 | $1,819 +19.3% | $143,100 +43.5% |
| 1998 | $1,525 | $99,700 |
Find assessor info on the county website
Monthly payment
Est. payment
Payment breakdown
Explore the cost of this home by adjusting the details. Changes won't be saved.Climate risks
Neighborhood: 02050
Similar homes
- $479,9003 bd1 ba1k sqft526 Crescent St, Brockton, MA 02302For Sale
 MLS ID #73598458, Jason Hargrove, Hargrove & Associates Real Estate, LLC. MLS PIN
- $479,0003 bd1 ba1.4k sqft31 Hope St, Brockton, MA 02302For Sale
 MLS ID #73591290, Weinstein Keach Group, Coldwell Banker Realty - Easton. MLS PIN
- $440,0003 bd2 ba1.3k sqft105 Crestfield Dr, Brockton, MA 02302For Sale
 MLS ID #73583127, Robert Lindo, Conway - Hanover. MLS PIN
- $475,0003 bd1 ba1.7k sqft490 North Ave, Rockland, MA 02370For Sale
 MLS ID #73539757, Mark A. Maraglia, EXIT Premier Real Estate. MLS PIN
