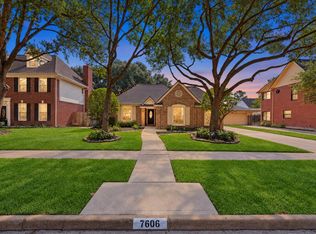
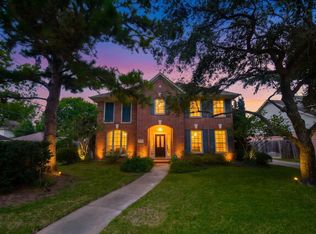
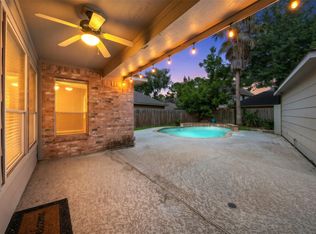
$265,800
3 bd2 ba1.7k sqft
7807 Hidden Oaks Ln, Houston, TX 77095
Off Market
Zillow last checked:
Listing updated:
Angelica Riveros TREC #0706061 832-857-8539,
Keller Williams Memorial

$281,100
$267,000 - $295,000
$1,997/mo
| Date | Event | Price |
|---|---|---|
| 6/17/2022 | Listing removed | -- |
Source:  RE/MAX International Report a problem | ||
| 5/16/2022 | Pending sale | $299,900$159/sqft |
Source:  HAR #42073756 Report a problem | ||
| 5/11/2022 | Listed for sale | $299,900+66.7%$159/sqft |
Source: HAR #42073756 Report a problem | ||
| 6/27/2016 | Sold | -- |
Source: Agent Provided Report a problem | ||
| 5/7/2016 | Pending sale | $179,900$95/sqft |
Source: Better Homes and Gardens Real Estate Gary Greene #56681681 Report a problem | ||
| 5/2/2016 | Price change | $179,900-4.8%$95/sqft |
Source: Better Homes and Gardens Real Estate Gary Greene #56681681 Report a problem | ||
| 4/14/2016 | Listed for sale | $189,000+45.5%$100/sqft |
Source: BHGRE Gary Greene #56681681 Report a problem | ||
| 12/16/2015 | Listing removed | $1,800$1/sqft |
Source: Better Homes and Gardens Real Estate Gary Greene #47001604 Report a problem | ||
| 10/31/2015 | Listed for rent | $1,800$1/sqft |
Source: Better Homes and Gardens Real Estate Gary Greene #47001604 Report a problem | ||
| 4/25/2012 | Listing removed | $129,900$69/sqft |
Source: RE/MAX REALTY CENTER #74913194 Report a problem | ||
| 10/21/2011 | Price change | $129,900-1.9%$69/sqft |
Source: RE/MAX Realty Center #74913194 Report a problem | ||
| 10/8/2011 | Price change | $132,400-1.9%$70/sqft |
Source: RE/MAX Realty Center #74913194 Report a problem | ||
| 9/17/2011 | Price change | $134,900-3.6%$71/sqft |
Source: RE/MAX Realty Center #74913194 Report a problem | ||
| 8/23/2011 | Listed for sale | $139,900$74/sqft |
Source: RE/MAX Realty Center #74913194 Report a problem | ||
| Year | Property taxes | Tax assessment |
|---|---|---|
| 2025 | $2,099 +1.4% | $271,243 -0.9% |
| 2024 | $2,070 +2% | $273,658 -7.4% |
| 2023 | $2,030 +57.3% | $295,396 +19.3% |
| 2022 | $1,290 | $247,613 +22.7% |
| 2021 | -- | $201,747 +5.7% |
| 2020 | $1,231 +3.4% | $190,868 +5% |
| 2019 | $1,191 -66.1% | $181,779 +7.1% |
| 2018 | $3,514 | $169,753 |
| 2017 | $3,514 +3.7% | $169,753 +3.8% |
| 2016 | $3,389 +5.9% | $163,509 |
| 2015 | $3,200 | $163,509 +13.5% |
| 2014 | $3,200 | $144,072 +8.7% |
| 2013 | -- | $132,598 |
| 2012 | -- | $132,598 |
| 2011 | -- | $132,598 |
| 2010 | -- | $132,598 |
| 2009 | -- | $132,598 +0.8% |
| 2007 | -- | $131,534 +2.3% |
| 2006 | -- | $128,600 |
| 2005 | -- | $128,600 |
| 2004 | -- | $128,600 |
| 2003 | -- | $128,600 +10% |
| 2002 | -- | $116,900 |
| 2001 | -- | $116,900 +7.6% |
| 2000 | -- | $108,600 |
Source: HAR. This data may not be complete. We recommend contacting the local school district to confirm school assignments for this home.

A local agent can set up tours, give advice and negotiate with sellers.