This 1367 square foot single family home has 3 bedrooms and 2.0 bathrooms. This home is located at 7944 Katella Way, Citrus Heights, CA 95621.
Pre-foreclosure
Est. $476,200
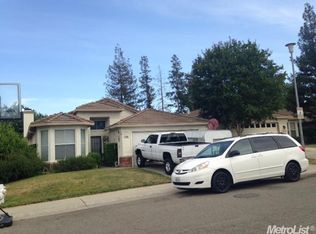
7944 Katella Way, Citrus Heights, CA 95621
3beds
1,367sqft
SingleFamily
Built in 1995
4,508 Square Feet Lot
$476,200 Zestimate®
$348/sqft
$-- HOA
Overview
- 145 days |
- 20 |
- 1 |
Facts & features
Interior
Bedrooms & bathrooms
- Bedrooms: 3
- Bathrooms: 2
- Full bathrooms: 2
Heating
- Forced air, Gas
Cooling
- Central
Appliances
- Included: Dishwasher, Garbage disposal, Range / Oven, Refrigerator
- Laundry: Inside Room
Features
- Flooring: Tile, Hardwood
- Has fireplace: Yes
- Fireplace features: Wood Burning, Family Room, Outside
Interior area
- Structure area source: Assessor Agent-Fill
- Total interior livable area: 1,367 sqft
Property
Parking
- Total spaces: 2
- Parking features: Garage
Accessibility
- Accessibility features: Grab Bars
Features
- Exterior features: Stucco, Wood
- Fencing: Wood, Back Yard
Lot
- Size: 4,508 Square Feet
- Features: Street Lights, Curb(s)/Gutter(s), Auto Sprinkler F&R
Details
- Parcel number: 20907400310000
- Zoning: residential
- Special conditions: Standard
Construction
Type & style
- Home type: SingleFamily
- Architectural style: Ranch
Materials
- wood frame
- Roof: Tile
Condition
- Year built: 1995
Utilities & green energy
- Sewer: In & Connected
- Water: Public, Meter on Site, Water District
- Utilities for property: Natural Gas Connected, Underground Utilities
Community & HOA
Location
- Region: Citrus Heights
Financial & listing details
- Price per square foot: $348/sqft
- Tax assessed value: $475,186
- Annual tax amount: $7,152
- Road surface type: Paved, Asphalt
Visit our professional directory to find a foreclosure specialist in your area that can help with your home search.
Find a foreclosure agentForeclosure details
Estimated market value
$476,200
$452,000 - $500,000
$2,520/mo
Price history
| Date | Event | Price |
|---|---|---|
| 4/21/2021 | Sold | $439,000+2.1%$321/sqft |
Source: MetroList Services of CA #221014961 Report a problem | ||
| 3/8/2021 | Pending sale | $429,888$314/sqft |
Source: Wesely & Associates Inc. #221014961 Report a problem | ||
| 3/5/2021 | Listed for sale | $429,888+62.2%$314/sqft |
Source: Wesely & Associates Inc. #221014961 Report a problem | ||
| 7/24/2015 | Sold | $265,000-1.5%$194/sqft |
Source: MetroList Services of CA #15031714 Report a problem | ||
| 6/15/2015 | Price change | $269,000-3.6%$197/sqft |
Source: Johnson & Johnson Real Estate Group Inc Report a problem | ||
| 5/13/2015 | Listed for sale | $279,000+2.6%$204/sqft |
Source: Johnson & Johnson Real Estate Group Inc Report a problem | ||
| 8/31/2007 | Sold | $272,000-15.3%$199/sqft |
Source: Public Record Report a problem | ||
| 5/25/2007 | Sold | $321,308-14.3%$235/sqft |
Source: Public Record Report a problem | ||
| 6/14/2005 | Sold | $375,000+133.6%$274/sqft |
Source: Public Record Report a problem | ||
| 8/30/2000 | Sold | $160,500+32.1%$117/sqft |
Source: MetroList Services of CA #142004898 Report a problem | ||
| 10/18/1995 | Sold | $121,500$89/sqft |
Source: Public Record Report a problem | ||
Public tax history
| Year | Property taxes | Tax assessment |
|---|---|---|
| 2025 | $7,152 -2.8% | $475,186 +2% |
| 2024 | $7,357 +2.4% | $465,869 +2% |
| 2023 | $7,183 -0.2% | $456,735 +2% |
| 2022 | $7,195 +99.2% | $447,780 +56.3% |
| 2021 | $3,611 +1.9% | $286,532 +1% |
| 2020 | $3,544 +2% | $283,595 +2% |
| 2019 | $3,474 +1.2% | $278,035 +2% |
| 2018 | $3,433 +1% | $272,584 +2% |
| 2017 | $3,399 +6.9% | $267,240 +2% |
| 2016 | $3,181 +17.7% | $262,000 +8.9% |
| 2015 | $2,703 | $240,522 +5% |
| 2014 | $2,703 | $229,069 +25% |
| 2013 | -- | $183,255 +14% |
| 2012 | -- | $160,750 -6% |
| 2011 | -- | $171,012 -8% |
| 2010 | -- | $185,884 -31.7% |
| 2008 | -- | $272,000 -20.8% |
| 2007 | -- | $343,331 -10.2% |
| 2006 | -- | $382,500 +120.5% |
| 2005 | -- | $173,501 +2% |
| 2004 | -- | $170,100 +1.9% |
| 2003 | -- | $166,984 +2% |
| 2002 | -- | $163,710 +2% |
| 2001 | -- | $160,500 +22.5% |
| 2000 | -- | $130,968 |
Find assessor info on the county website
Monthly payment
Estimated monthly payment$1,822
All calculations are estimates and provided by Zillow, Inc. for informational purposes only. Actual amounts may vary.
HOA fees may include property taxes on listings classified as Co-Ops. Contact the listing agent and/or owner for fee details.
Mortgage interest rates are dependent on a number of factors, including credit score, down payment, and repayment length. Interest rate data provided by Zillow Group Marketplace, Inc. as of 1/1/1970 from various mortgage lenders with which we have lead or other similar arrangements; the Estimated Payment is an average of those rates.
See how much you could borrow to make a competitive offer.
Climate risks
Neighborhood: Northwest
Nearby schools
GreatSchools rating
- 5/10Lichen K-8Grades: K-8Distance: 1 mi
- 3/10Mesa Verde High SchoolGrades: 9-12Distance: 1.5 mi


- California
- Sacramento County
- Citrus Heights
- 95621
- Northwest
- 7944 Katella Way
Nearby cities
Nearby neighborhoods
Nearby zip codes
Other Citrus Heights Topics
