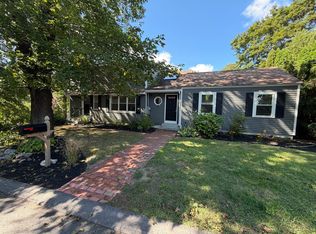
Waterfont life on Lake Ripple! Home sits on peninsula with no through traffic for privacy. This wonderful North Grafton property is off the beaten path but nearby to Routes 122, 140, and the Mass Pike, and approximately 3.5 miles to the commuter rail for making travel convenient. Come check out this rare lakefront property!
For sale
$559,000
8 Logan Path, North Grafton, MA 01536
3beds
1,450sqft
Single Family Residence
Built in 1999
6,699 Square Feet Lot
$558,800 Zestimate®
$386/sqft
$-- HOA
What's special
Rare lakefront property
- 3 days
- 313
- 26
Zillow last checked:
Listing updated:
Listed by:
Jeffrey Brodeur 508-873-1913,
The O'Rourke Group Real Estate Professionals 774-312-6615
Source: MLS PIN,MLS#: 73596472
Facts & features
Interior
Bedrooms & bathrooms
- Bedrooms: 3
- Bathrooms: 3
- Full bathrooms: 2
- 1/2 bathrooms: 1
Heating
- Forced Air, Oil
Cooling
- Central Air
Features
- Basement: Full
- Number of fireplaces: 1
Interior area
- Total structure area: 1,450
- Total interior livable area: 1,450 sqft
- Finished area above ground: 1,450
Property
Parking
- Total spaces: 5
- Parking features: Paved Drive
- Garage spaces: 1
- Uncovered spaces: 4
Features
- Has view: Yes
- View description: Scenic View(s)
- Waterfront features: Waterfront, Lake
Lot
- Size: 6,699 Square Feet
Details
- Parcel number: M:0055.0 B:0000 L:0024,1525860
- Zoning: R2
Construction
Type & style
- Home type: SingleFamily
- Architectural style: Colonial
- Property subtype: Single Family Residence
Materials
- Foundation: Concrete Perimeter
Condition
- Year built: 1999
Utilities & green energy
- Sewer: Public Sewer
- Water: Public
Community & HOA
HOA
- Has HOA: No
Location
- Region: North Grafton
Financial & listing details
- Price per square foot: $386/sqft
- Tax assessed value: $455,500
- Annual tax amount: $6,236
- Date on market: 10/28/2026
Estimated market value
$558,800
$531,000 - $587,000
$3,377/mo
Price history
| Date | Event | Price |
|---|---|---|
| 10/29/2026 | Listed for sale | $559,000+184.2%$386/sqft |
Source: MLS PIN #73596472 Report a problem | ||
| 12/13/1999 | Sold | $196,690$136/sqft |
Source: Public Record Report a problem | ||
Public tax history
| Year | Property taxes | Tax assessment |
|---|---|---|
| 2025 | $6,153 +2.2% | $441,400 +4.9% |
| 2024 | $6,022 +7.9% | $420,800 +18.4% |
| 2023 | $5,583 +7.4% | $355,400 +15.5% |
| 2022 | $5,196 +2.3% | $307,800 +4.2% |
| 2021 | $5,077 +5.1% | $295,500 +0.9% |
| 2020 | $4,831 +1.2% | $292,800 +2.2% |
| 2019 | $4,775 +3.7% | $286,600 +3.3% |
| 2018 | $4,604 +10.1% | $277,500 +8.9% |
| 2017 | $4,180 +0.6% | $254,900 +2.7% |
| 2016 | $4,157 +0.8% | $248,200 -0.6% |
| 2015 | $4,122 +8.2% | $249,800 +0% |
| 2014 | $3,810 -6.5% | $249,700 -4.7% |
| 2013 | $4,073 +1.9% | $261,900 -7.4% |
| 2012 | $3,997 +15.4% | $282,900 +11.3% |
| 2011 | $3,465 +4.6% | $254,200 -4.6% |
| 2010 | $3,313 -5.2% | $266,500 -17.4% |
| 2009 | $3,494 +0.4% | $322,600 -6.8% |
| 2008 | $3,480 -2.9% | $346,300 -7.8% |
| 2007 | $3,583 +11.9% | $375,600 +18.2% |
| 2006 | $3,203 +1.4% | $317,800 +4.6% |
| 2005 | $3,158 +6.1% | $303,900 +10.3% |
| 2004 | $2,977 +7.6% | $275,400 +49.3% |
| 2003 | $2,768 +8.3% | $184,500 |
| 2001 | $2,557 +578.2% | $184,500 +659.3% |
| 1999 | $377 | $24,300 |
Find assessor info on the county website
Monthly payment
Est. payment
Payment breakdown
Explore the cost of this home by adjusting the details. Changes won't be saved.Climate risks
Neighborhood: 01536
Similar homes
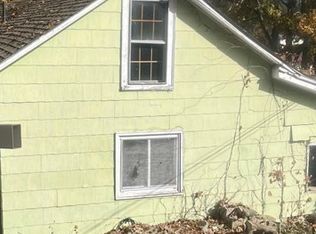
- $519,9003 bd2 ba1.6k sqft96 East St, North Grafton, MA 01536For Sale
 MLS ID #73597200, Brennan Doherty, The Hive Real Estate LLC. MLS PIN
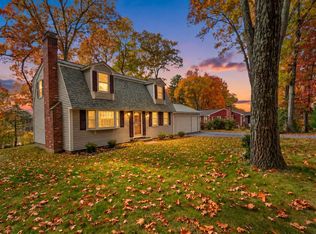
- $600,0003 bd3 ba1.7k sqftFlint Pond Estates, North Grafton, MA 01536For Sale
 MLS ID #73596858, Colleen Crowley, Lamacchia Realty, Inc.. MLS PIN
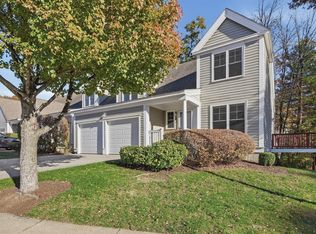
- $640,0003 bd3 ba2k sqft61 Barbara Jean St, Grafton, MA 01519For Sale
 MLS ID #73595809, Sagar Shah, Sagar Shah Realty Group LLC. MLS PIN
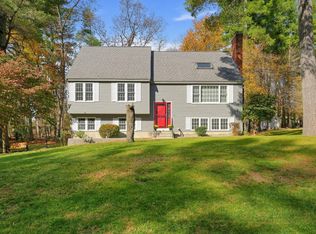
- $599,9004 bd2 ba1.9k sqft8 Kessell St, Grafton, MA 01519For Sale
 MLS ID #73584301, The APEX Team, Results Realty. MLS PIN
