$340,000
3 bd|3 ba|1.5k sqft
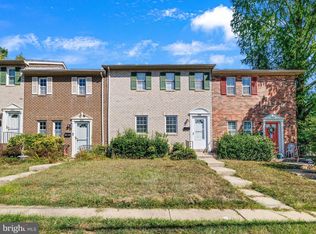
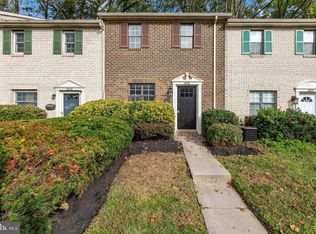
8050 Sandy Spring Rd, Laurel, MD 20707
Sold
Zillow last checked:
Listing updated:
Ray Edwards 240-832-4066,
Own Real Estate (240) 615-8395
$379,300
$360,000 - $398,000
$2,981/mo
| Date | Event | Price |
|---|---|---|
| 5/17/2019 | Sold | $241,000+0.5%$118/sqft |
Source: Public Record Report a problem | ||
| 3/12/2019 | Price change | $239,900-4%$118/sqft |
Source: Samson Properties #MDPG460926 Report a problem | ||
| 2/7/2019 | Listed for sale | $249,900+44.9%$123/sqft |
Source: Samson Properties #MDPG460926 Report a problem | ||
| 7/29/2016 | Sold | $172,500-4.1%$85/sqft |
Source: Public Record Report a problem | ||
| 4/8/2016 | Price change | $179,900-2.7%$88/sqft |
Source: Keats & Co Real Estate LLC #PG9539544 Report a problem | ||
| 2/29/2016 | Price change | $184,900-7.5%$91/sqft |
Source: Keats & Co Real Estate LLC #PG9539544 Report a problem | ||
| 2/8/2016 | Price change | $199,900-9.1%$98/sqft |
Source: Keats & Co Real Estate LLC #PG9539544 Report a problem | ||
| 1/11/2016 | Price change | $219,900-2.2%$108/sqft |
Source: Keats & Co Real Estate LLC #PG9539544 Report a problem | ||
| 12/19/2015 | Listed for sale | $224,900+45.7%$111/sqft |
Source: Keats & Co Real Estate LLC #PG9539544 Report a problem | ||
| 10/9/2015 | Sold | $154,401+47.2%$76/sqft |
Source: Public Record Report a problem | ||
| 10/31/1997 | Sold | $104,900$52/sqft |
Source: Public Record Report a problem | ||
| Year | Property taxes | Tax assessment |
|---|---|---|
| 2025 | $4,049 +41.9% | $268,200 +4.5% |
| 2024 | $2,855 +4.7% | $256,700 +4.7% |
| 2023 | $2,727 +4.9% | $245,200 +4.9% |
| 2022 | $2,599 +9.6% | $233,700 +9.6% |
| 2021 | $2,370 +10.7% | $213,133 +10.7% |
| 2020 | $2,141 -16.2% | $192,567 +12% |
| 2019 | $2,556 | $172,000 |
| 2018 | $2,556 | $172,000 |
| 2017 | $2,556 +3836.4% | $172,000 |
| 2016 | $65 | $172,000 |
| 2015 | $65 | $172,000 |
| 2014 | $65 | $172,000 -13.1% |
| 2013 | -- | $198,000 |
| 2012 | -- | $198,000 |
| 2011 | -- | $198,000 -36.5% |
| 2010 | -- | $312,000 +16.1% |
| 2009 | -- | $268,666 +19.2% |
| 2008 | -- | $225,333 +23.8% |
| 2007 | -- | $182,000 +15.2% |
| 2006 | -- | $158,000 +17.9% |
| 2005 | -- | $134,000 +21.8% |
| 2004 | -- | $110,000 |
| 2003 | -- | $110,000 +2.8% |
| 2002 | -- | $107,000 +5.9% |
| 2001 | -- | $101,000 |
Find assessor info on the county website
Source: Bright MLS. This data may not be complete. We recommend contacting the local school district to confirm school assignments for this home.
A local agent can set up tours, give advice and negotiate with sellers.