$492,100
3 bd|1 ba|1.4k sqft
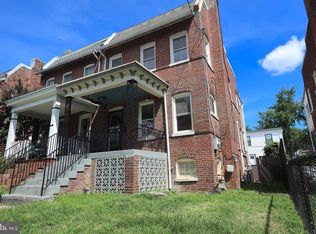
801 Quackenbos St NW, Washington, DC 20011
Off Market
Zillow last checked:
Listing updated:
Chris PERRY 301-254-5411,
Compass
$407,800
$387,000 - $428,000
$4,264/mo
| Date | Event | Price |
|---|---|---|
| 1/9/2026 | Sold | $410,000-13.7%$263/sqft |
Source: | ||
| 12/23/2025 | Pending sale | $475,000$304/sqft |
Source: | ||
| 12/16/2025 | Listed for sale | $475,000$304/sqft |
Source: | ||
| Year | Property taxes | Tax assessment |
|---|---|---|
| 2025 | $1,465 +1.2% | $565,220 +1.1% |
| 2024 | $1,448 +1.1% | $558,840 +5% |
| 2023 | $1,433 +0.4% | $532,060 +12.2% |
| 2022 | $1,427 +4.3% | $474,340 +3.7% |
| 2021 | $1,368 +4.8% | $457,230 +3.2% |
| 2020 | $1,306 +9.4% | $443,140 +5% |
| 2018 | $1,194 +9.6% | $422,070 +6% |
| 2017 | $1,089 +9.7% | $398,170 +13.4% |
| 2016 | $992 +9.9% | $351,260 +9.5% |
| 2015 | $903 +9.4% | $320,660 +14.2% |
| 2014 | $826 +9.4% | $280,830 +2.7% |
| 2013 | $755 +9% | $273,440 -5.2% |
| 2012 | $693 | $288,290 |
| 2011 | $693 +21% | $288,290 -14.4% |
| 2010 | $572 +16% | $336,710 -12.9% |
| 2009 | $494 +9.4% | $386,500 +14.2% |
| 2007 | $451 +5.2% | $338,350 +44.6% |
| 2006 | $429 -14.7% | $233,930 +25.4% |
| 2005 | $503 +12% | $186,550 +21.5% |
| 2004 | $449 +12% | $153,540 +35.3% |
| 2003 | $401 +5.1% | $113,479 +3.7% |
| 2002 | $381 +5.4% | $109,426 +3.8% |
| 2001 | $362 | $105,373 |
Find assessor info on the county website
Source: Bright MLS. This data may not be complete. We recommend contacting the local school district to confirm school assignments for this home.
A local agent can set up tours, give advice and negotiate with sellers.